

A Power BI supply chain dashboard pulls data from your ERP, warehouse management system, and supplier feeds into one live view so you can see inventory levels, order status, and supplier performance without waiting for someone to pull a report. For operations leaders, that means catching a supplier delay or an inventory shortfall while there’s still time to act on it, not after the customer already noticed.
We’ve done Power BI development services for manufacturers and distributors managing exactly this problem, decisions made on week-old spreadsheets instead of what’s happening on the floor right now. Below, we’ll cover the dashboard types worth building (KPI, shipping status, supplier performance, logistics), the metrics that actually matter and how businesses in manufacturing and healthcare are using them.
Core Features of Power BI for Supply Chain Analytics
From seamless data connectivity to intuitive visualization capabilities and seamless integration with other Microsoft products, Power BI emerges as a vital asset in optimizing supply chain operations. Below are some core features that might be beneficial for your business in the long run:
- Collaboration and Sharing to overcome Data Silos: Power BI offers real-time data sharing capabilities, a key feature that addresses the challenge of data silos. Often, data can be altered by various team members, leading to discrepancies and disruptions in information flow to stakeholders. With Power BI’s real-time data sharing, stakeholders have access to the most up-to-date information, overcoming data silos and ensuring transparency and accuracy across the organization.
- Data Connectivity: Power BI enables seamless integration with various data sources, including ERP systems, warehouse management systems, and external data feeds. This ensures that supply chain data from disparate sources can be aggregated and analyzed within the Power BI environment.
- Data Transformation and Modeling: With Power BI, users can perform advanced data transformation and modeling operations to prepare raw supply chain data for analysis. This includes cleaning data, defining relationships, and creating calculated columns or measures to derive meaningful insights.
- Interactive Data Visualization: Power BI offers a rich set of interactive visualizations, such as charts, graphs, maps, and dashboards, to explore and analyze supply chain data. These visualizations provide stakeholders with intuitive ways to understand complex data patterns and trends.
- Custom Dashboards and Reports: Power BI allows users to create custom dashboards and reports tailored to their specific supply chain analytics needs. These dashboards can be designed to display key performance indicators (KPIs), track metrics, and monitor supply chain network in real-time.
- Natural Language Querying: Power BI’s natural language querying feature enables users to ask questions about their supply chain data using everyday language. This intuitive interface makes it easy for users to generate insights and explore data without the need for complex queries or formulas.
- Integration with Other Microsoft Products: Power BI seamlessly integrates with other Microsoft products and services, such as Excel, SharePoint, and Teams. This integration streamlines the process of analyzing and sharing supply chain data within the organization, fostering collaboration and alignment.
Types of Supply Chain Dashboards
Supply chain dashboards serve as vital tools for monitoring, analyzing, and managing various aspects of supply chain operations. Here’s an in-depth look at three common types of supply chain dashboards:
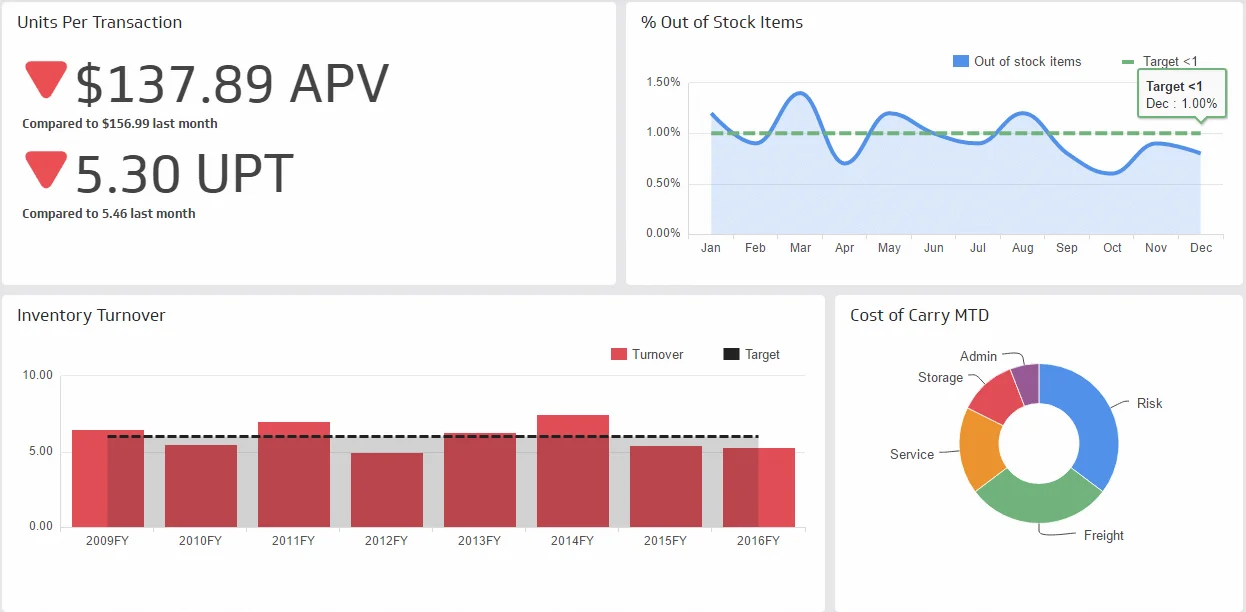
Units Per Transaction Metric: This metric calculates the average number of units sold per transaction. It provides insights into customer purchasing behavior and helps evaluate sales performance efficiency. A higher units per transaction metric typically indicates higher customer engagement and potential revenue growth.
Inventory to Sales Ratio: The inventory to sales ratio compares the value of inventory to the value of sales over a specific period. It helps assess inventory levels relative to sales demand, providing insights into inventory control effectiveness. A lower inventory to sales ratio suggests lean inventory practices, while a higher ratio may indicate excess inventory that needs to be managed or reduced.
2. Shipping Status Dashboard
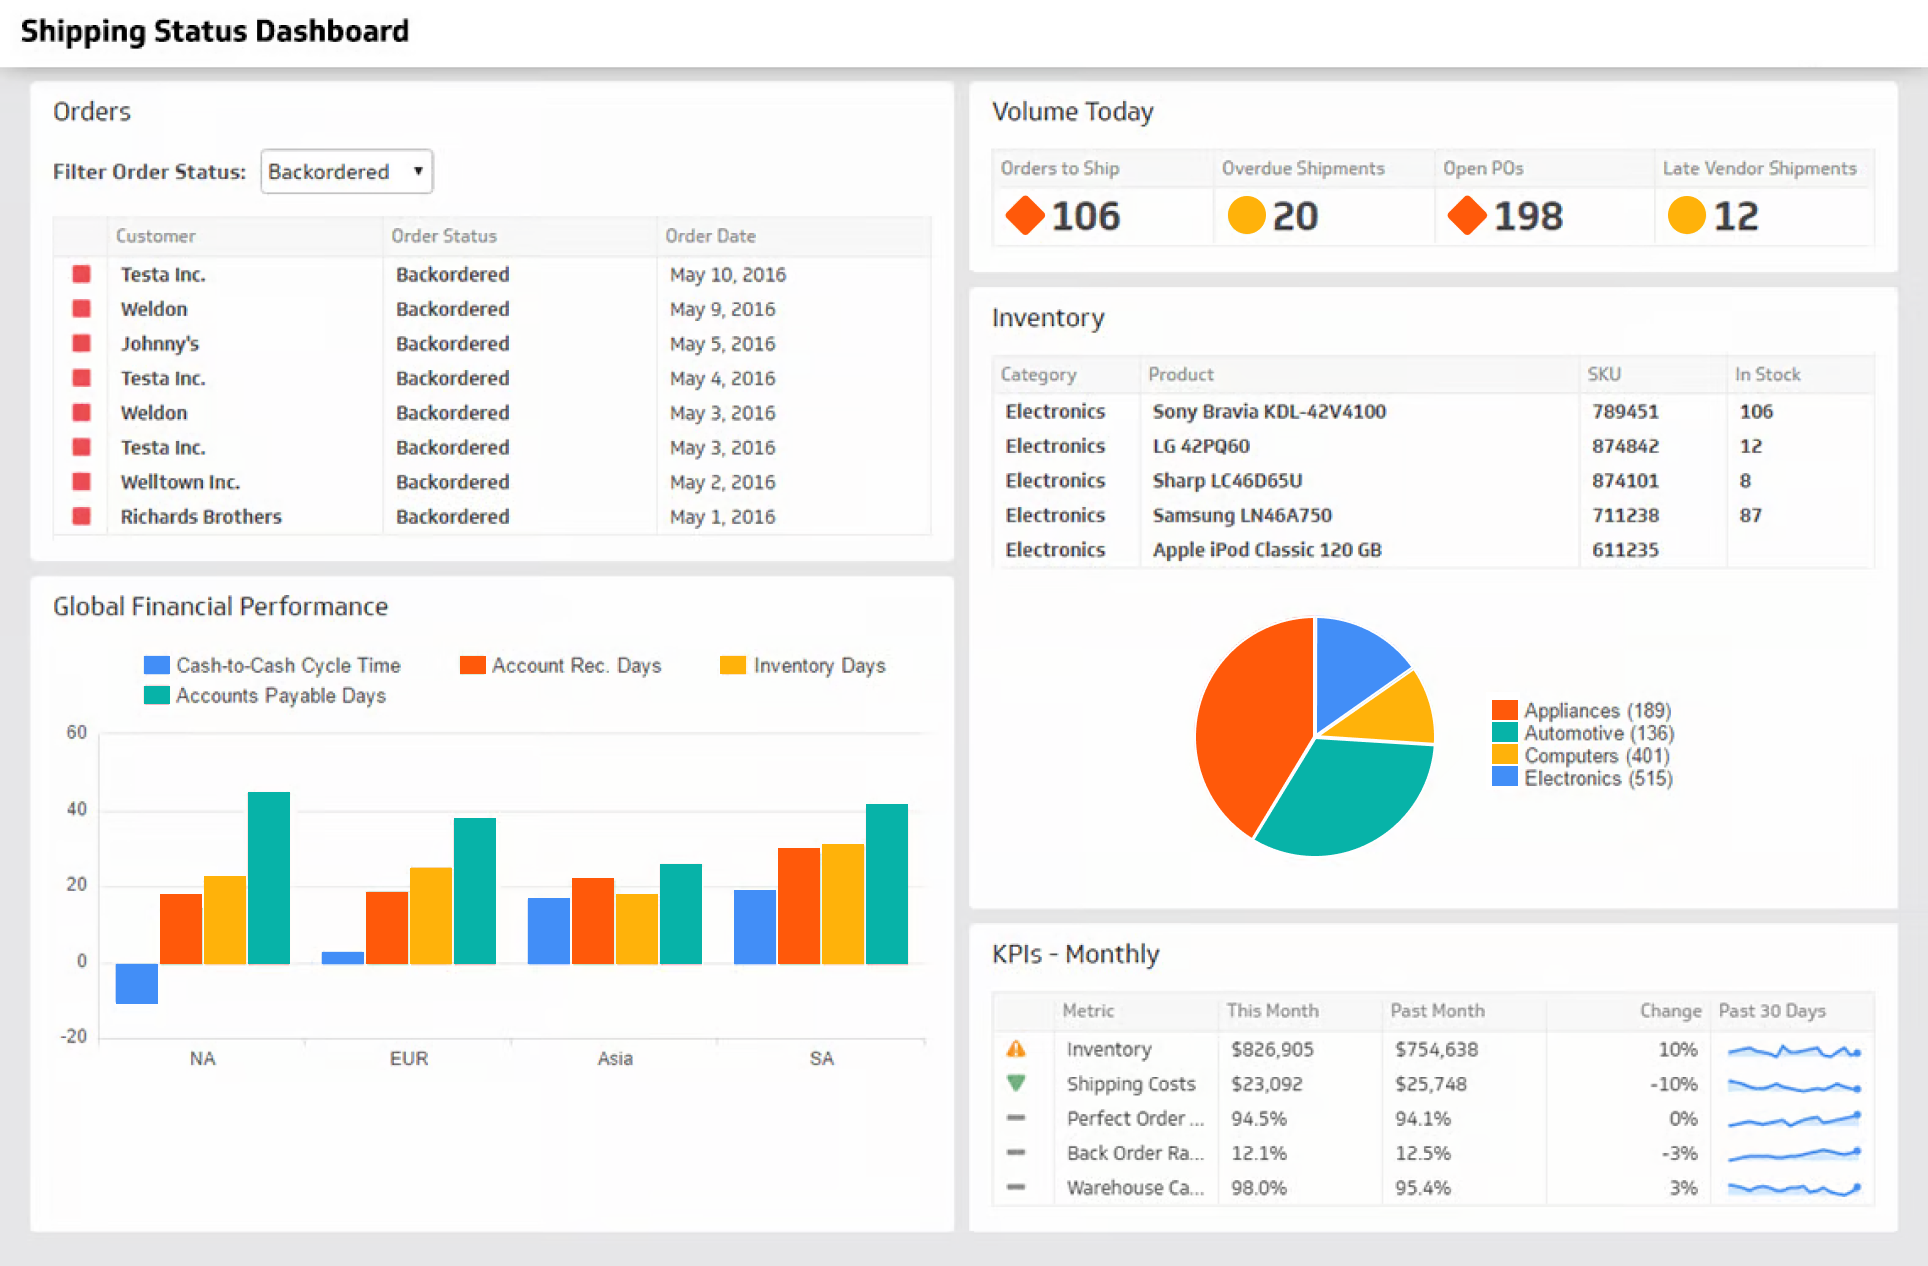
Order Status: This dashboard component provides real-time visibility into the status of customer orders. It includes information such as order processing stage, shipping status, and estimated delivery dates. Monitoring order status helps ensure timely order fulfillment and consumer satisfaction.
Order Tracking: Order tracking functionality enables stakeholders to track the movement of orders throughout the supply chain. It provides real-time updates on order location, transit times, and delivery status. Order tracking enhances transparency and allows proactive management of order fulfillment processes.
3. Warehouse Order Performance Dashboard
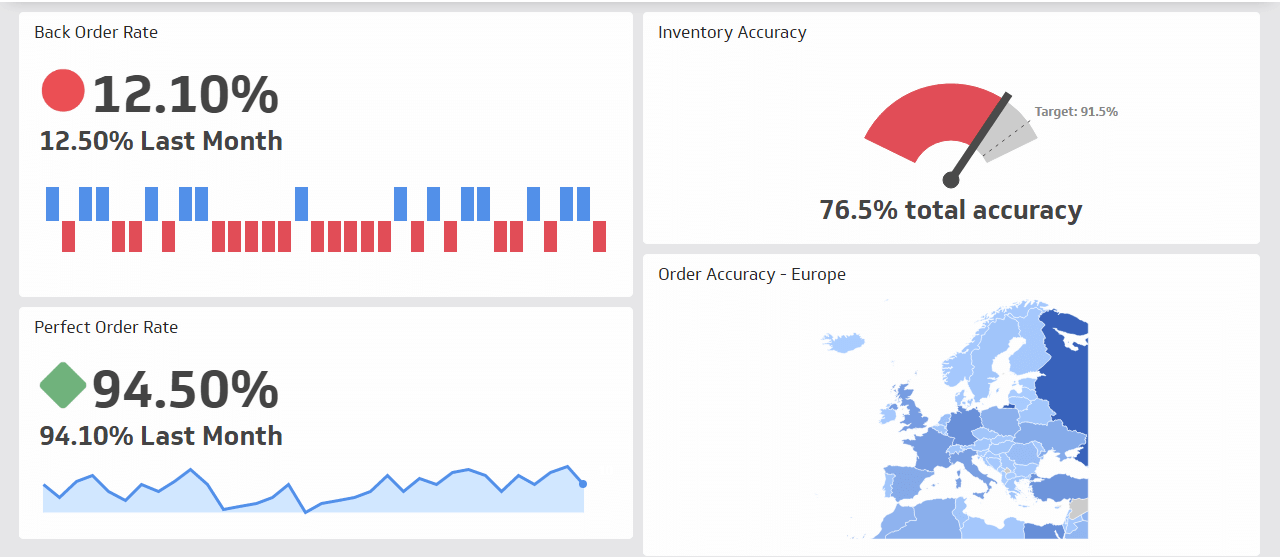
Inventory Accuracy: Inventory accuracy measures the precision of inventory records by comparing physical inventory counts to system records. It helps identify discrepancies and improve inventory management processes. High inventory accuracy ensures reliable inventory data for effective decision-making.
Perfect Order Rate: The perfect order rate evaluates the percentage of orders that are delivered to customers without any errors or defects. It considers factors such as on-time delivery, complete order fulfillment, and accurate product condition. A high perfect order rate reflects operational excellence.
Back Order Rate: The back order rate measures the percentage of customer orders that cannot be fulfilled from available inventory and are placed on backorder. It indicates supply chain responsiveness and inventory availability. Monitoring the back order rate helps identify potential inventory shortages and fulfillment challenges.
Order Tracking: Similar to the shipping status dashboard, order tracking functionality provides visibility into the movement of orders within the warehouse. It includes tracking information such as order picking, packing, and shipping status. Order tracking enhances warehouse efficiency and enables proactive management of order fulfillment processes.
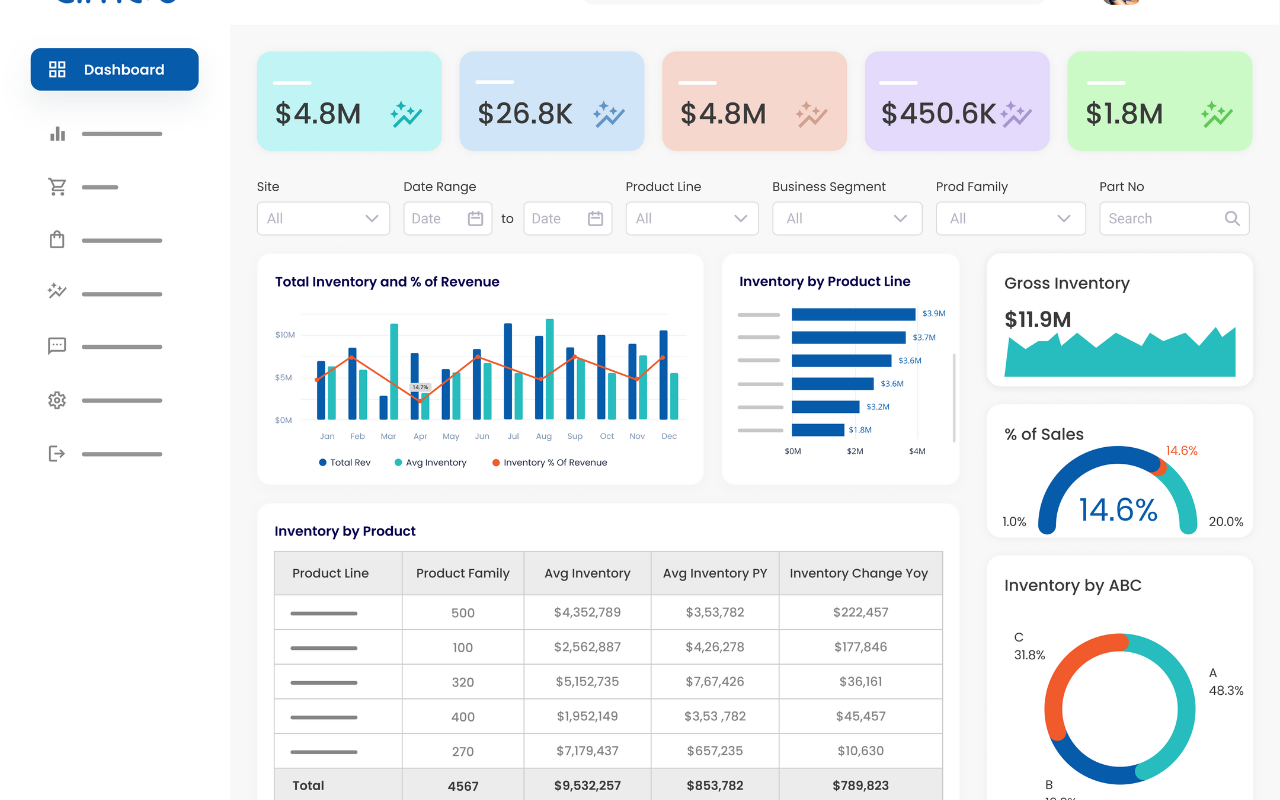
Inventory Turnover: Inventory turnover measures how efficiently a company manages its inventory by assessing how quickly inventory is sold or used within a specific time period. It’s calculated by dividing the cost of goods sold by the average inventory value. A high inventory turnover ratio indicates efficient inventory control and a healthy supply chain.
Demand Forecasting Dashboard: Demand forecasting dashboards help SMBs forecast future demand for their products or services based on historical sales data, demand patterns, and market trends. By analyzing demand data in real-time, SMBs can improve demand forecasting accuracy, optimize inventory levels, and ensure product availability to meet customer demand. This visibility allows SMBs to minimize stockouts, reduce excess inventory, and improve overall supply chain efficiency and responsiveness.
5. Supplier Performance Dashboard
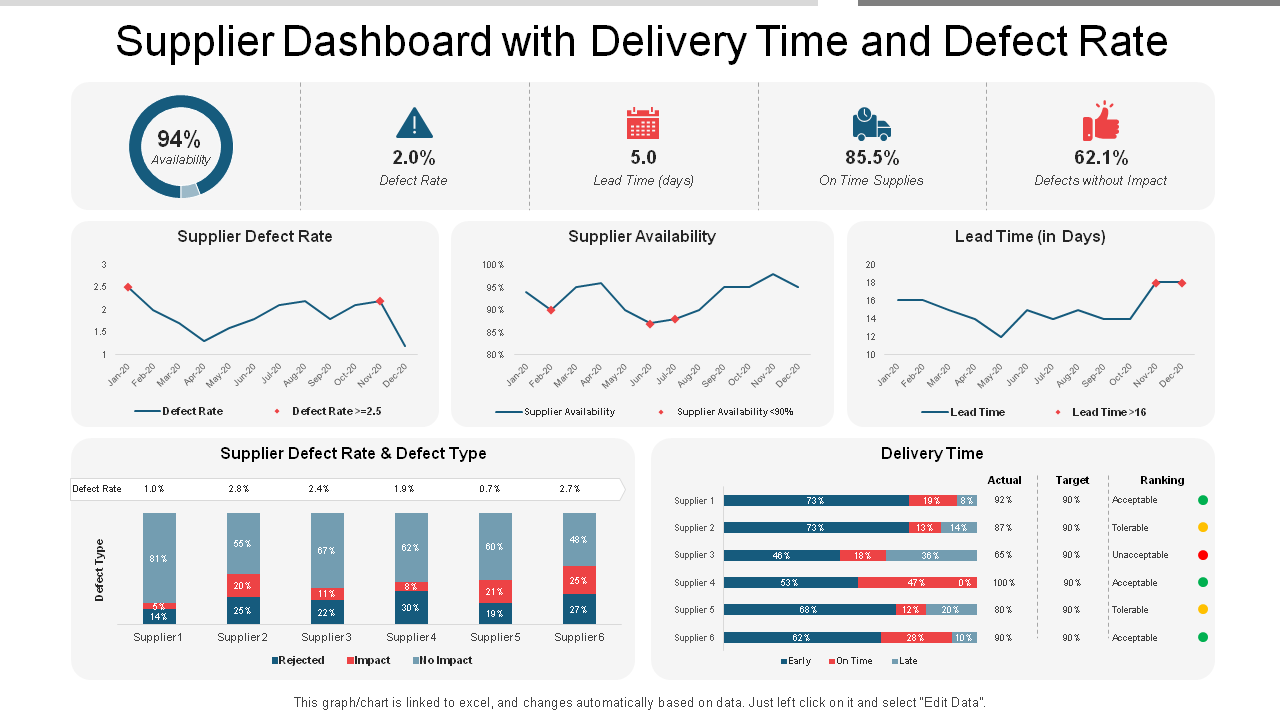
Supplier On-Time Delivery Dashboard: Monitoring supplier performance is crucial for small and medium-sized businesses (SMBs) to maintain efficient supply chain operations. The Supplier On-Time Delivery Dashboard provides valuable insights into supplier delivery performance, lead times, and fill rates. By tracking key metrics such as on-time delivery rate, lead time variance, and fill rate, SMBs can assess supplier reliability and adherence to delivery schedules.
Supplier Quality Dashboard: The Supplier Quality Dashboard offers comprehensive insights into the quality of products received from suppliers. By tracking metrics such as defect rate, product return rate, and quality control metrics, SMBs can identify potential quality issues early in the supply chain process. This dashboard enables proactive quality management and collaboration with suppliers to address quality issues and improve product reliability.
6. Customer Service Dashboard
Customer Satisfaction Dashboard: The Customer Satisfaction Dashboard provides a comprehensive overview of customer satisfaction scores, feedback ratings, and service response times. By aggregating data from various customer touchpoints such as surveys, reviews, and support interactions, SMBs can gain valuable insights into customer sentiment and perceptions of their products or services.
Order Fulfillment Cycle Time Dashboard: The Order Fulfillment Cycle Time Dashboard offers detailed analysis of order processing times, shipping delays, and on-time delivery rates. By tracking key metrics such as order processing time, order-to-delivery lead time, and order fulfillment cycle time, SMBs can identify bottlenecks and inefficiencies in their order fulfillment processes.
7. Logistics Dashboard
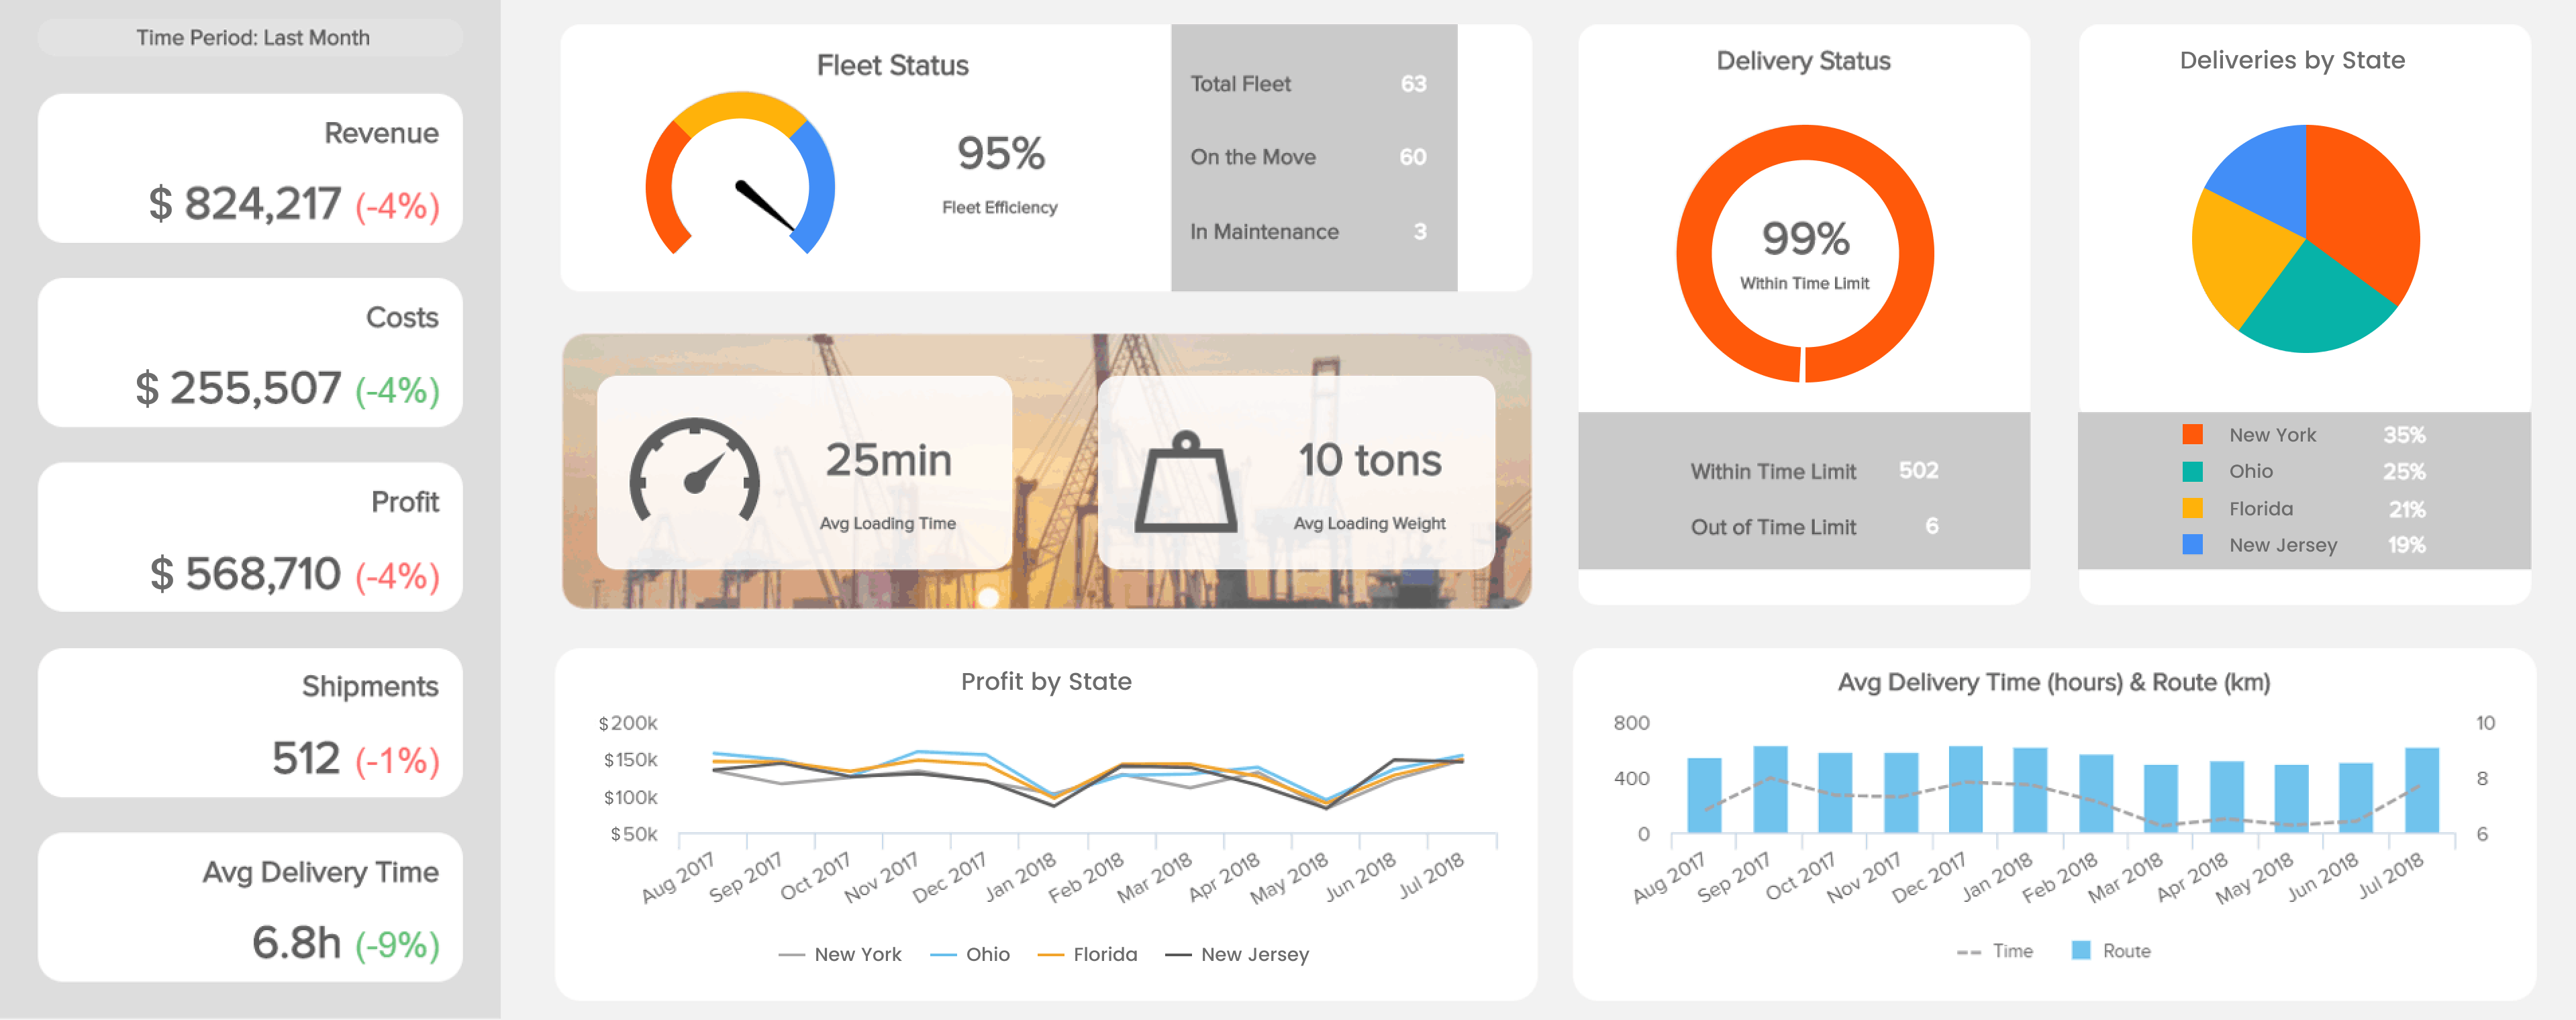
Transportation Cost Dashboard: The Transportation Cost Dashboard enables SMBs to monitor transportation costs per unit, freight expenses, and fuel consumption. By analyzing transportation costs across different modes of transportation (e.g., road, ra il, air, sea), SMBs can identify cost-saving opportunities, optimize route planning, and negotiate better freight rates with carriers. This dashboard also provides visibility into fuel consumption trends and helps SMBs track and manage their transportation budget effectively.
Warehouse Capacity Dashboard: The Warehouse Capacity Dashboard tracks warehouse capacity utilization, storage space availability, and warehouse throughput. SMBs can monitor warehouse occupancy rates, assess storage space utilization, and identify areas for optimization to maximize warehouse efficiency. This dashboard also helps SMBs plan and allocate storage space more effectively, streamline inventory management processes, and ensure sufficient capacity to meet growing demand. By optimizing warehouse capacity utilization, they can reduce storage costs, improve order fulfillment rates, and enhance overall supply chain performance.
A Compilation of Real-world Example
Pacific Corrugated Pipes (PCP)
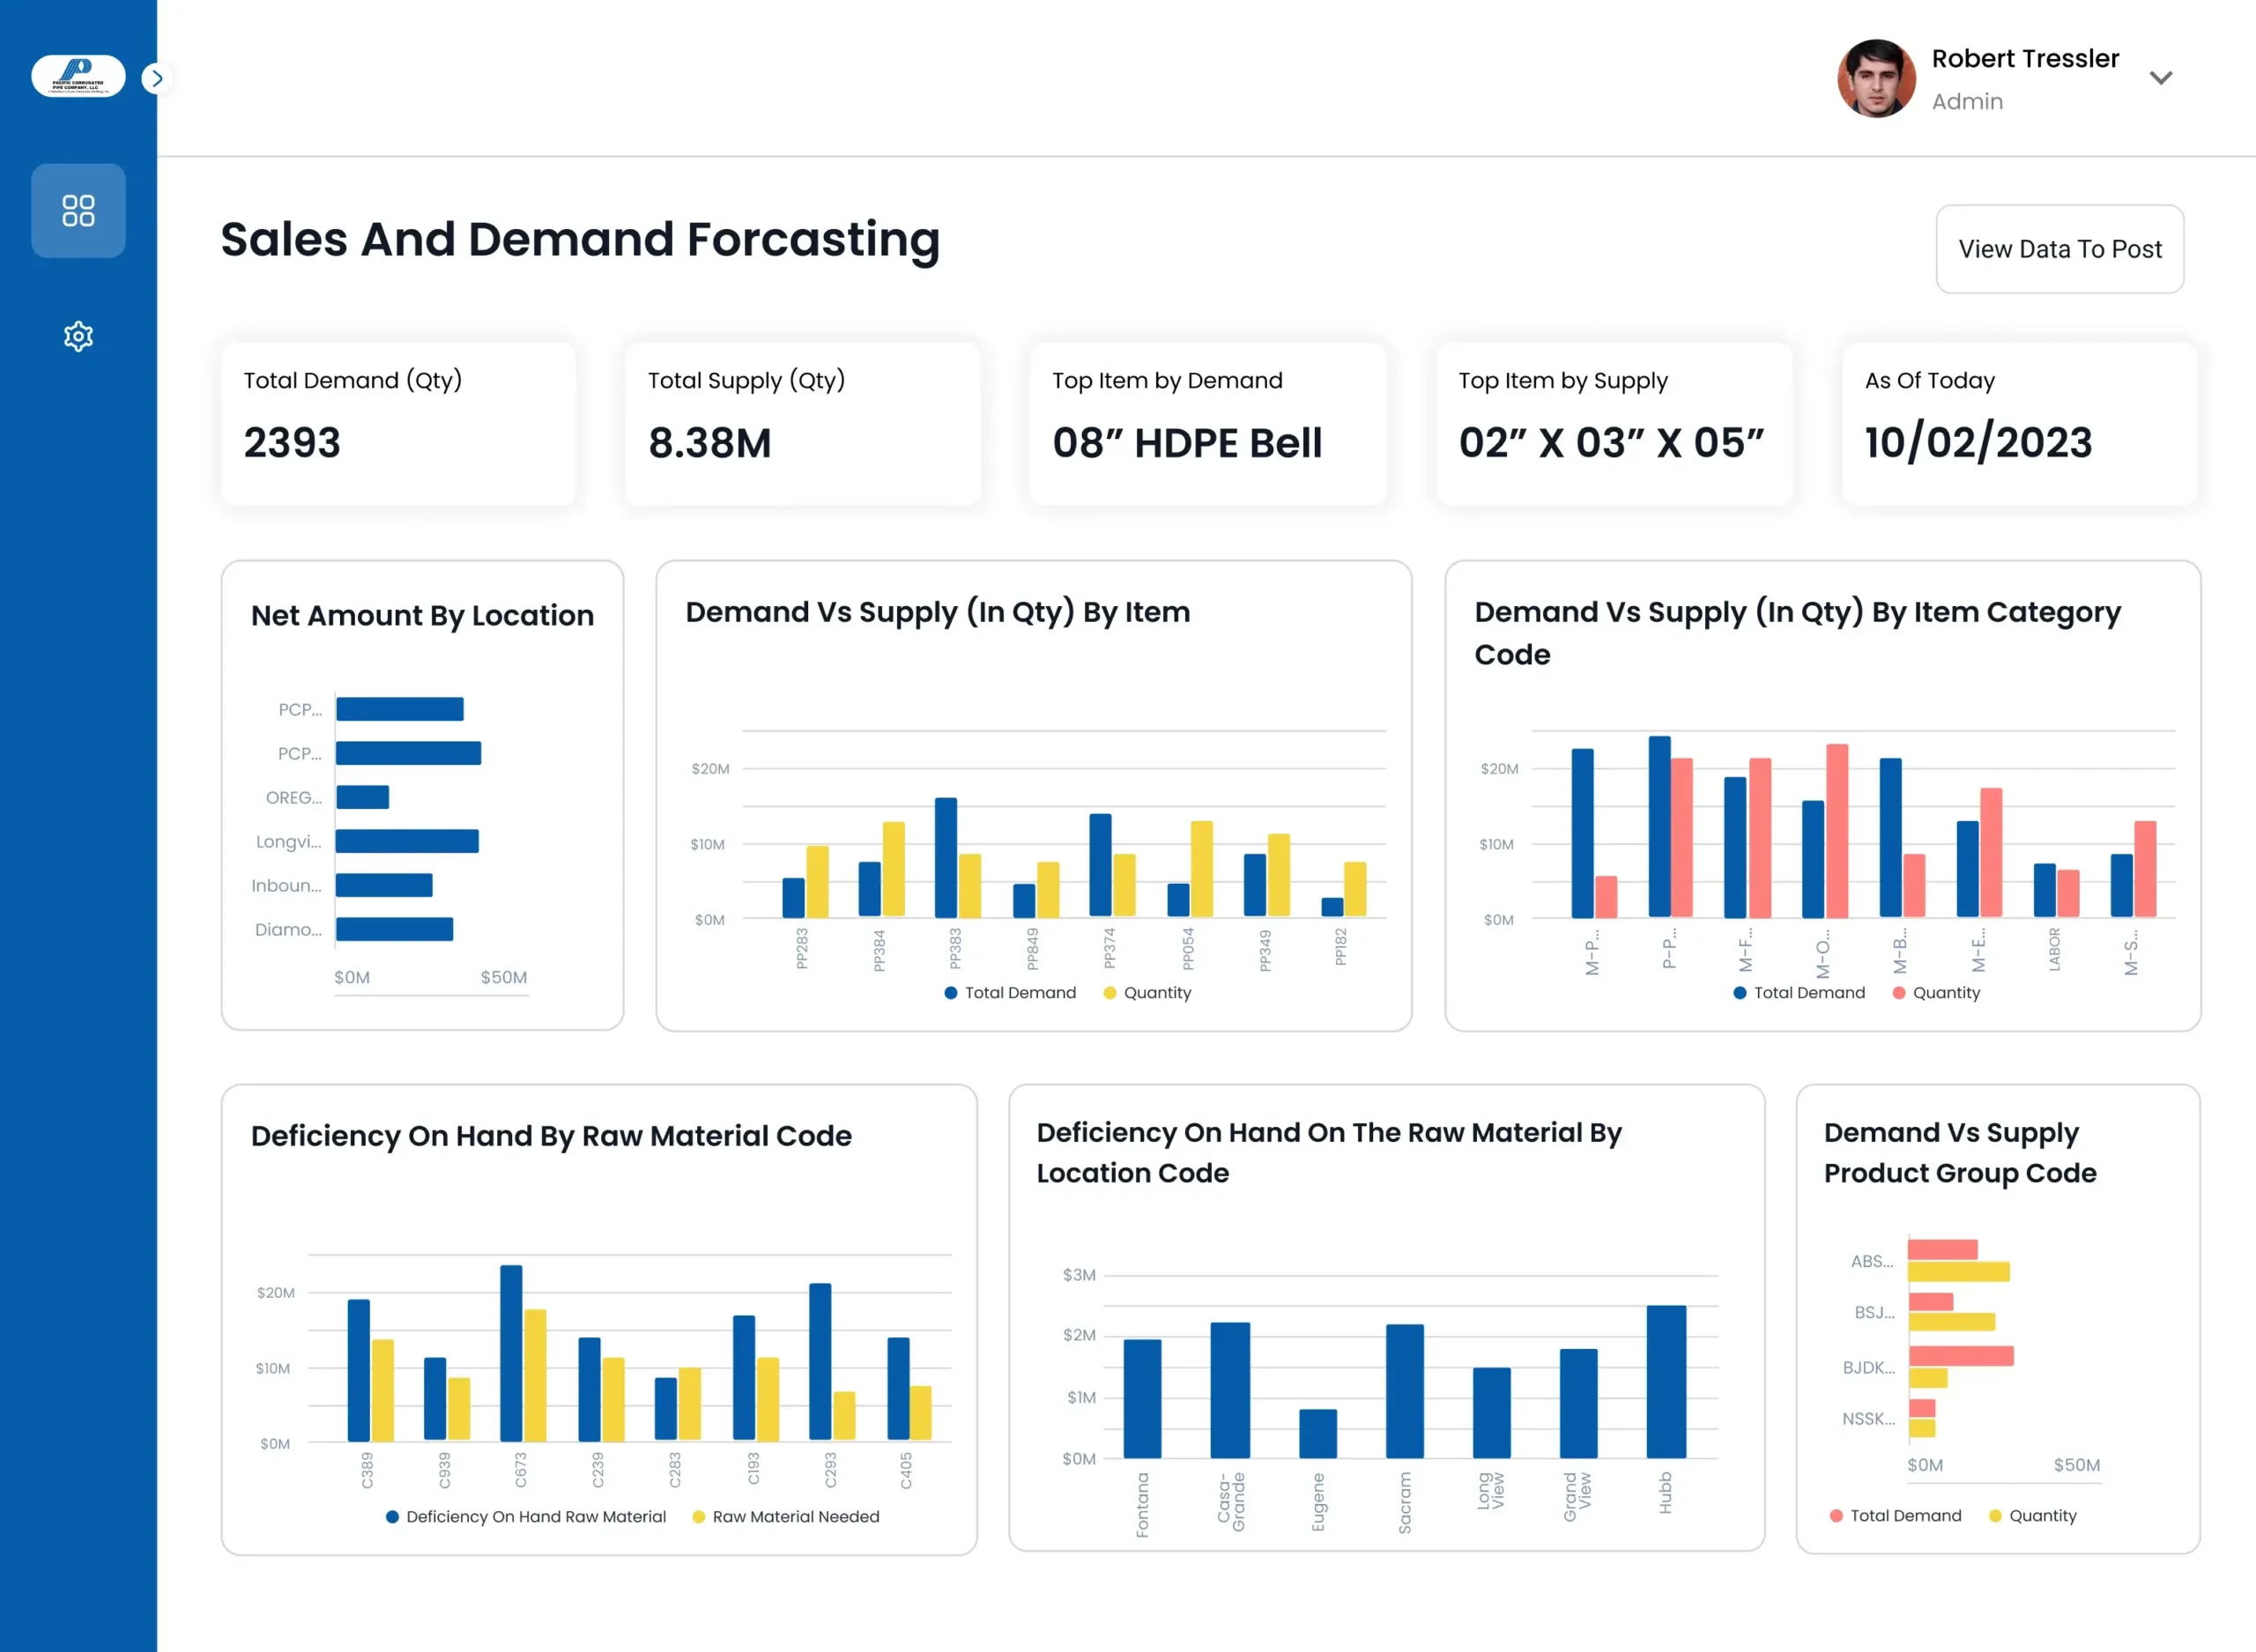
Pacific Corrugated Pipe Company (PCP) faced challenges with manual tracking of sales and finance data, decentralized decision-making, and inadequate insights into supply chain management. To address these issues, PCP implemented Power BI reporting integrated with Azure Data Lake and Synapse Analytics. This solution provided dashboards for sales by division, backlog sales orders, sales and demand forecasting, plant comparison, and income statement analysis. As a result, PCP streamlined decision-making processes, optimized supply chain management, and gained comprehensive insights into organizational performance. This transformation increased operational efficiency, empowered proactive decision-making, and positioned PCP for sustained competitiveness in the market.
Modular Assembly Innovations (MAI)
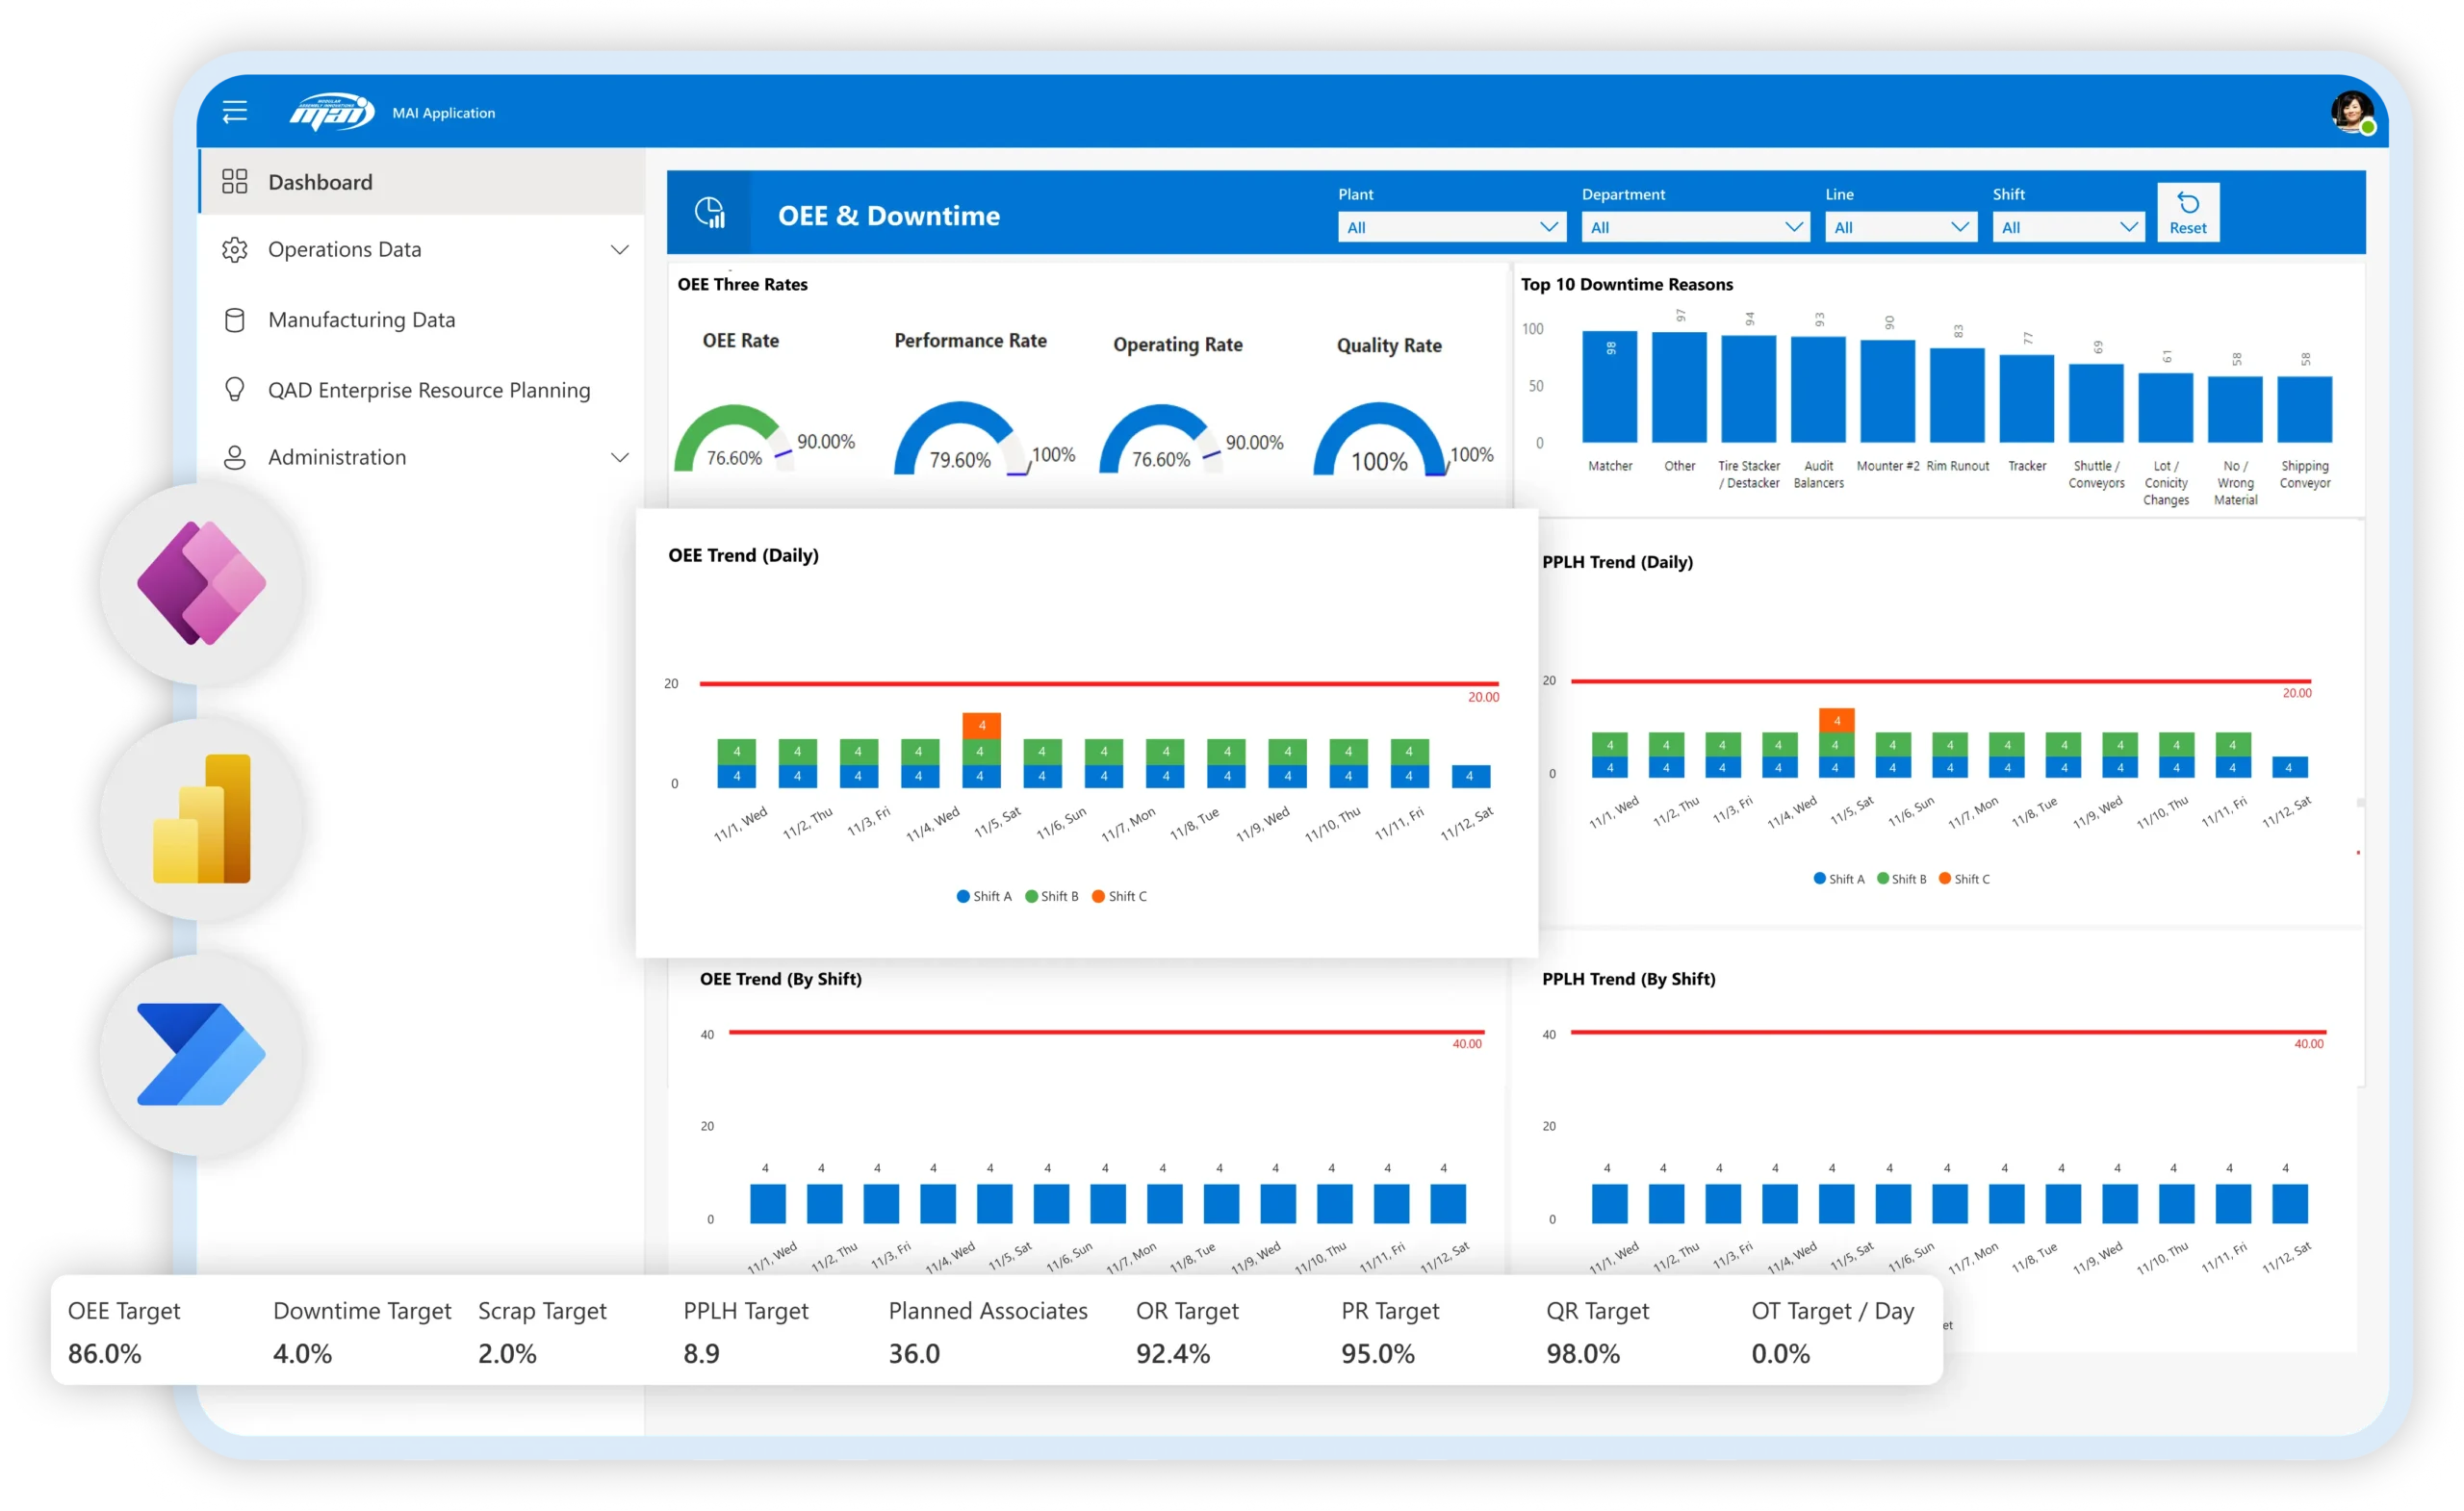
Modular Assembly Innovations (MAI) faced challenges with decentralized data storage and unreliable Excel reports, hindering efficient supply chain management. To address these issues, MAI implemented a comprehensive solution leveraging Power BI for structured data visualization, SQL for improved data management, and PowerApps for interactive data access. This integration significantly enhanced data accessibility and reliability, streamlining decision-making processes and ensuring data integrity. By overcoming these hurdles, MAI successfully optimized its supply chain management capabilities, paving the way for enhanced operational efficiency and informed strategic decisions.
AMOT
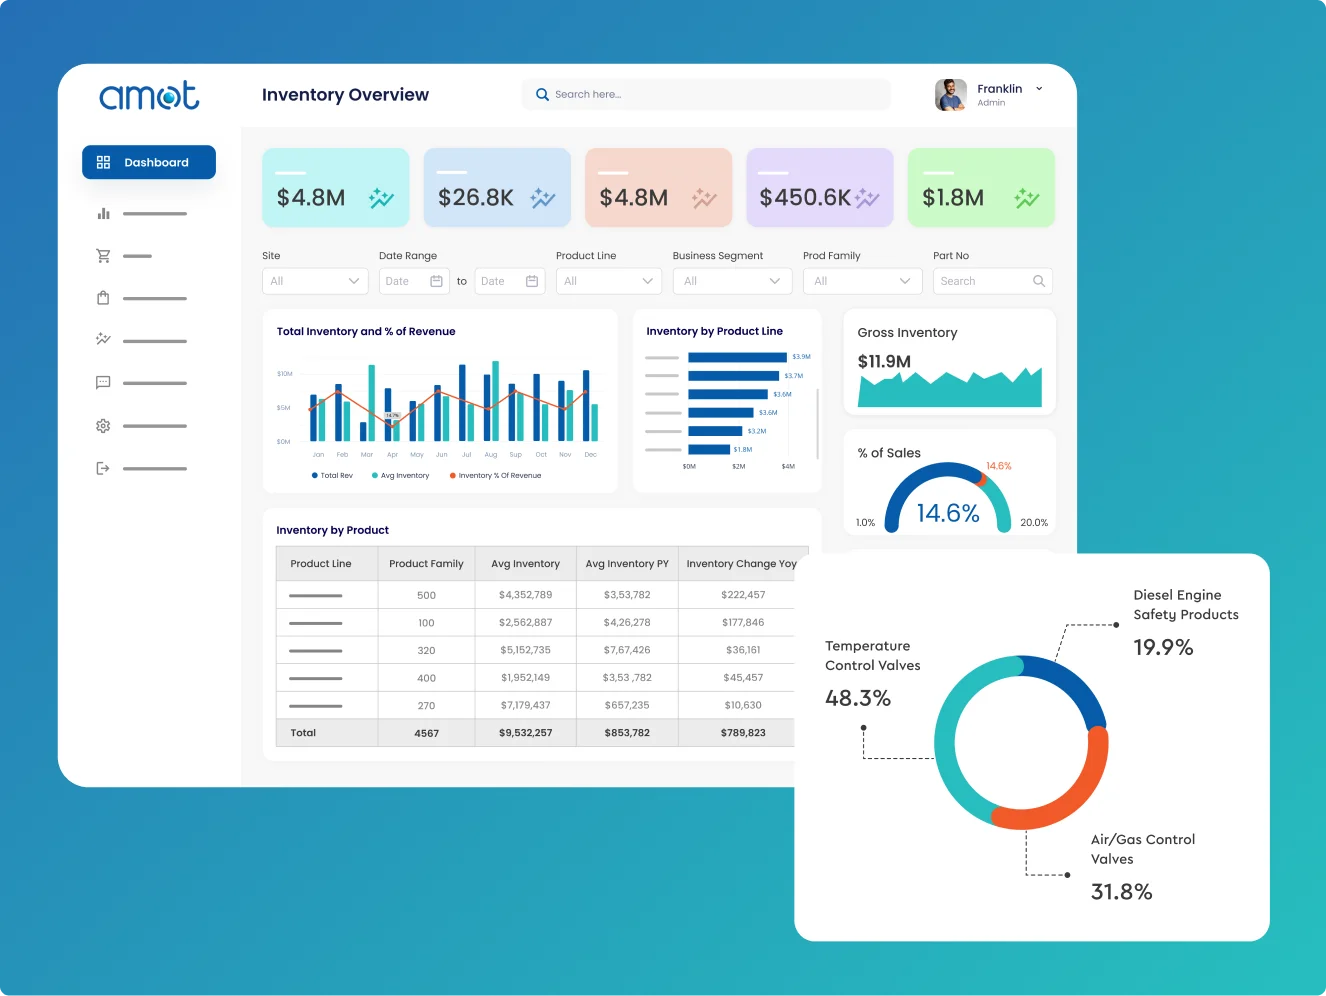
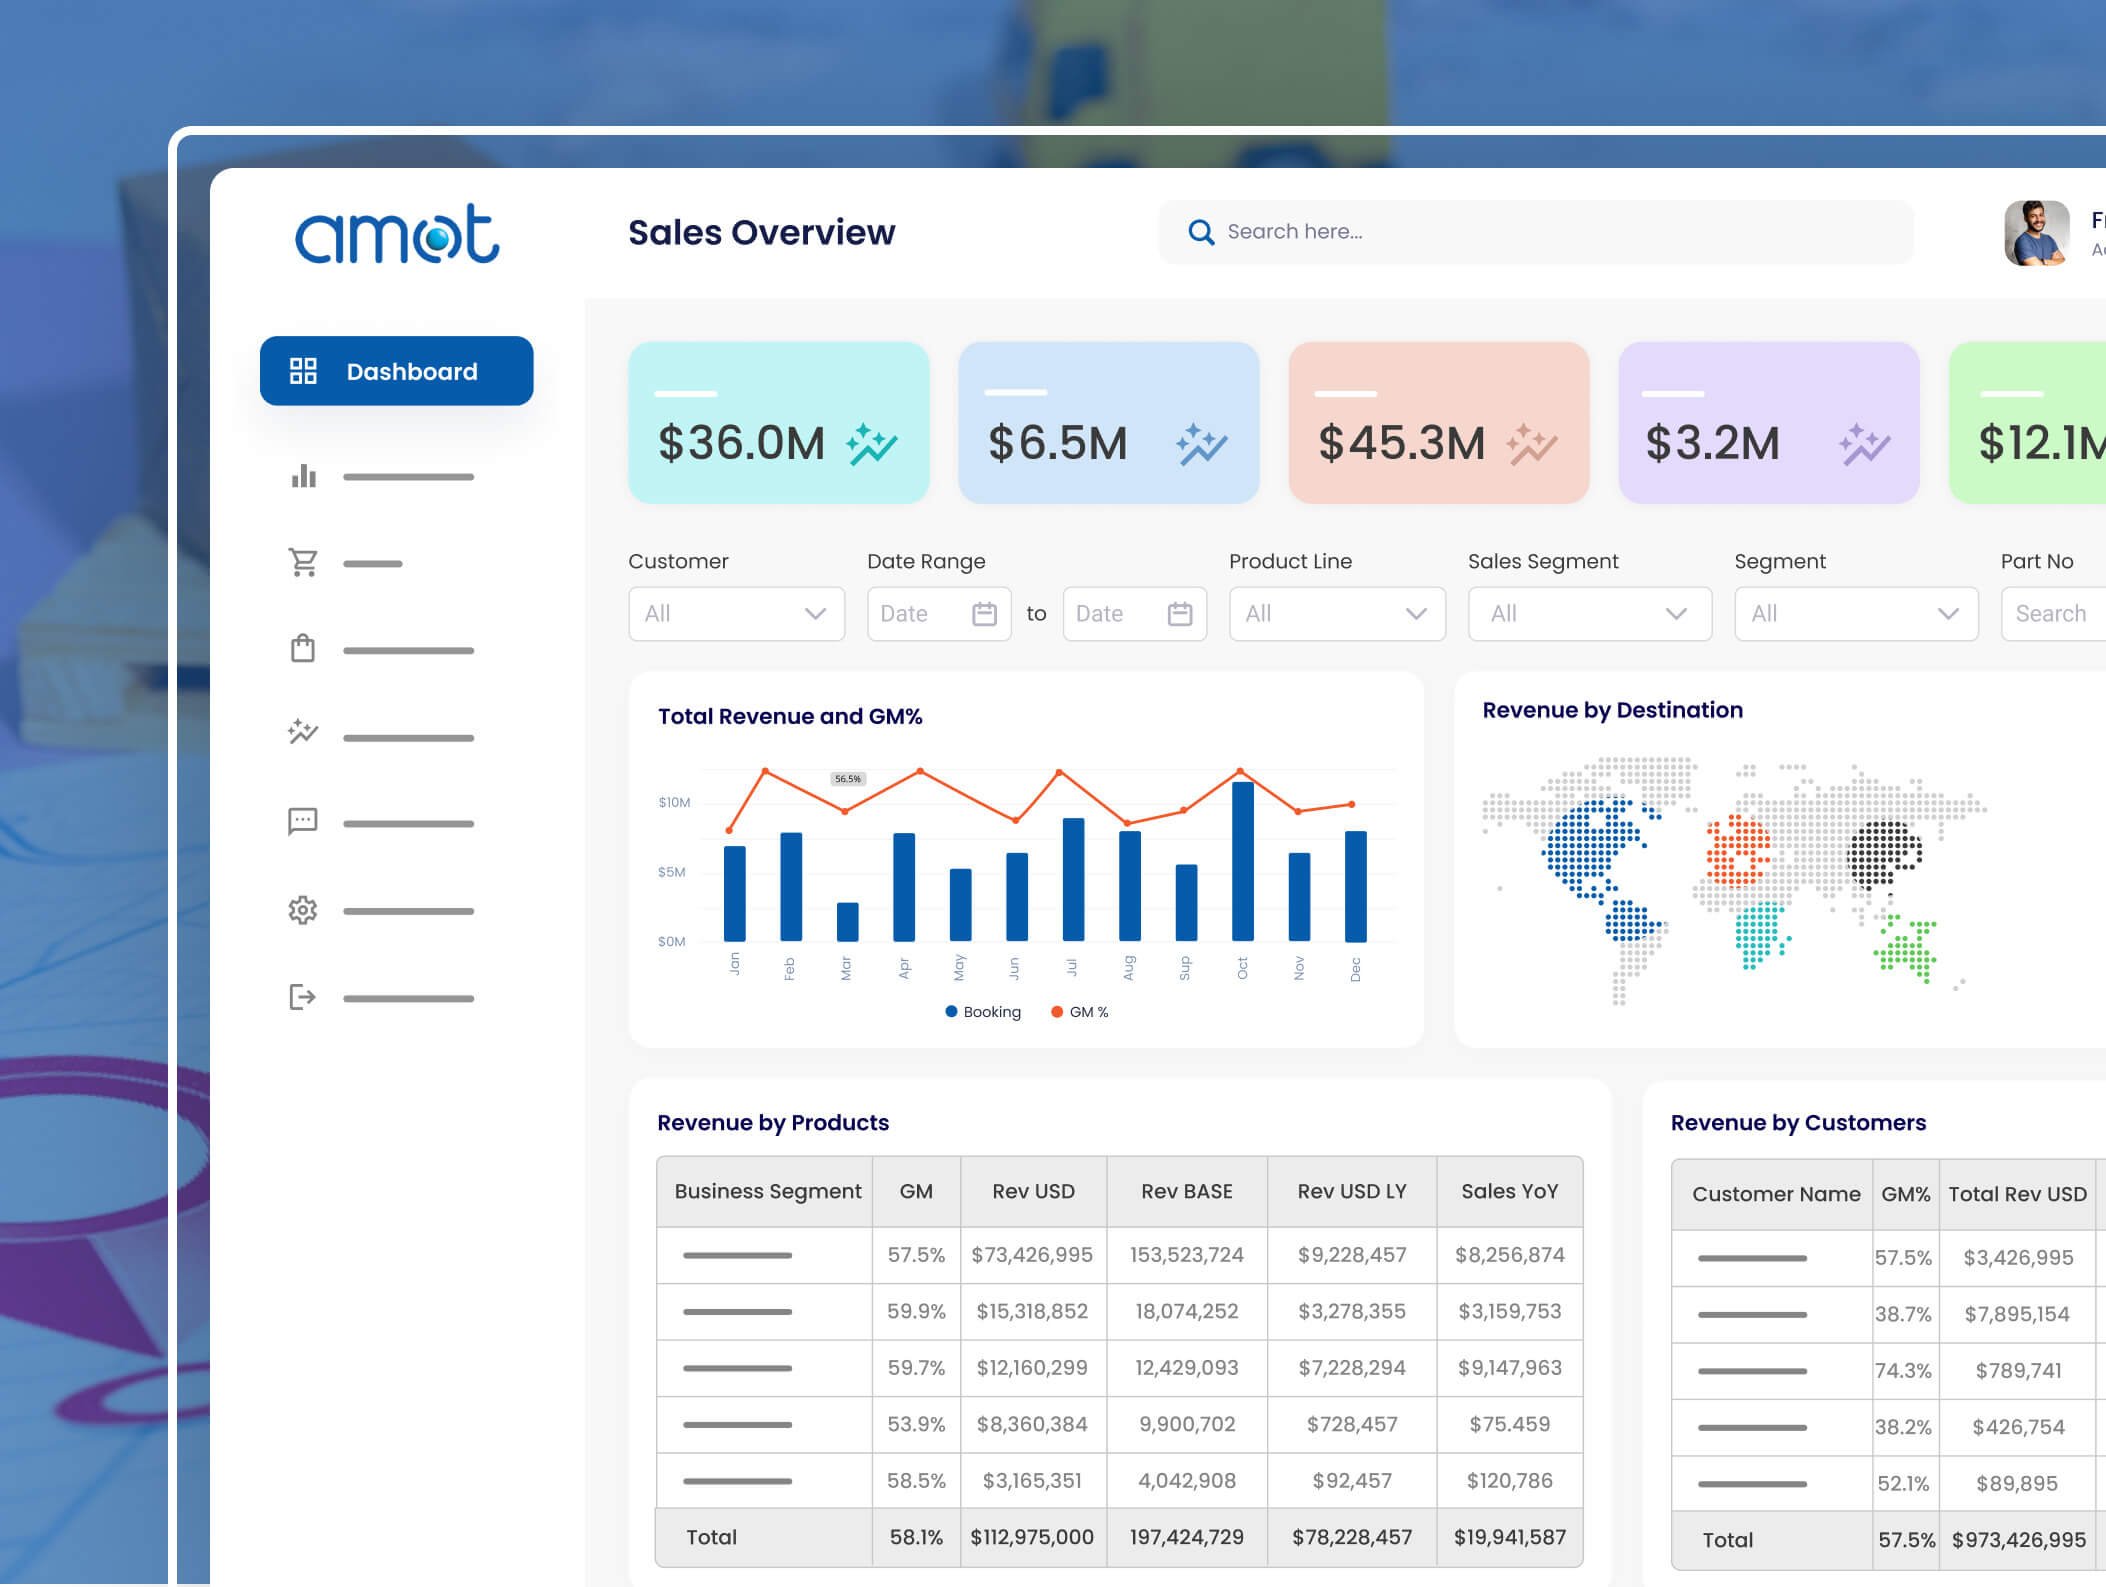
AMOT, a manufacturing business, faced challenges in managing extensive raw data from various sources, impeding real-time decision-making. To address this, AMOT partnered with Sunflower Lab to deploy Power BI dynamic dashboards empowered with Data Analysis Expressions (DAX), integrating Excel, Dynamic 365, SQL Server, and SSIS for comprehensive data management. This solution facilitated real-time data forecasting and visualization for key metrics such as revenue, inventory, backlog, orders, and bookings. As a result, AMOT gained access to up-to-date financial insights, efficiently navigated inventory challenges, accelerated data calculations through DAX empowerment, and made informed decisions based on real-time orders and booking information. This implementation streamlined AMOT’s supply chain management processes, enhancing operational efficiency and positioning the company for continued success in the manufacturing industry.
Supply Chain Operations KPIs & Metrics
Inventory Turnover
Inventory turnover measures how efficiently a company manages its inventory by assessing how quickly inventory is sold or used within a specific time period. A high inventory turnover ratio indicates efficient inventory control and a healthy supply chain. It signifies that products are moving quickly through the supply chain, reducing holding costs and minimizing the risk of obsolete inventory.
Days Inventory Outstanding (DIO)
Days Inventory Outstanding calculates the average number of days it takes for inventory to turn into sales. DIO provides insights into stock management efficiency. A lower DIO indicates faster inventory turnover and better liquidity, while a higher DIO may suggest excess inventory levels or slow-moving stock that ties up capital.
Perfect Order Rate (POR)
POR measures the percentage of orders that are delivered to customers without any errors or defects. POR reflects the accuracy and reliability of order fulfillment processes. A high POR indicates operational growth, while a low POR may result in customer dissatisfaction, returns, and increased costs due to rework or refunds.
Order Fulfillment Cycle Time
This tracks the time it takes to process and fulfill customer orders, from order placement to delivery. Shorter order fulfillment cycle times lead to improved consumer satisfaction, reduced lead times, and increased responsiveness to customer demand. Monitoring cycle times helps identify bottlenecks and inefficiencies in order processing and fulfillment workflows.
Supplier On-Time Delivery
Supplier On-Time Delivery measures the percentage of orders or shipments received from suppliers on or before the agreed-upon delivery date. Supplier on-time delivery performance impacts production schedules, inventory levels, and customer loyalty. Timely deliveries from suppliers ensure uninterrupted operations and minimize disruptions in the supply chain.
Cash-to-Cash Cycle Time
This calculates the average time it takes for cash to flow into the business from the sale of inventory to the time cash is paid to suppliers for new inventory. Cash-to-Cash Cycle Time measures liquidity and financial health. A shorter cash-to-cash cycle time indicates efficient cash flow management and better working capital efficiency, enabling the organization to reinvest cash and fund growth initiatives.
Transportation Cost per Unit
This is the average cost of transporting goods per unit shipped. Monitoring transportation costs helps optimize logistics operations and minimize expenses. By analyzing transportation cost per unit, organizations can identify cost-saving opportunities, negotiate better freight rates, and optimize transportation routes and modes.
Warehousing Cost per Order
It measures the average cost of warehousing operations per order processed. Warehousing costs impact overall supply chain expenses and profitability. By analyzing warehousing cost per order, organizations can identify inefficiencies in storage, handling, and fulfillment processes, and implement strategies to reduce costs and improve warehouse efficiency.
Return Rate
Return Rate calculates the percentage of products returned by customers due to defects, damages, or dissatisfaction. Return rate impacts product quality, and overall supply chain costs. High return rates indicate quality issues, poor customer service, and increased expenses associated with returns processing, restocking, and refunds.
Backorder Rate
It is the percentage of customer orders that cannot be fulfilled from available inventory and are placed on backorder. Backorder rate reflects supply chain responsiveness and inventory availability. Monitoring backorder rates helps identify potential inventory shortages, improve demand forecasting accuracy, and optimize inventory levels to meet customer demand.
Who Needs Supply Chain Data Visualization?
In healthcare, supply chain data visualization is crucial for ensuring efficient operations, optimal patient care, and regulatory compliance. Power BI supply chain dashboards can provide healthcare organizations with real-time visibility into inventory levels, medication usage, equipment availability, and supply chain logistics. Here’s how the healthcare industry can benefit from Power BI supply chain dashboards:
- Inventory Management: Healthcare facilities must manage a wide range of medical supplies, medications, and equipment to meet patient needs. Power BI dashboards can provide insights into inventory levels, expiration dates, and usage trends, allowing healthcare providers to optimize inventory management and prevent stockouts or overstocking.
- Supply Chain Efficiency: Efficient supply chain management is critical for ensuring timely delivery of medical supplies and equipment to healthcare facilities. Power BI dashboards enable healthcare organizations to track supplier performance, monitor shipping status, and identify potential bottlenecks in the supply chain, ensuring seamless operations and uninterrupted patient care.
- Patient Safety and Quality of Care: Timely access to medical supplies and equipment is essential for delivering high-quality patient care. Power BI dashboards can help healthcare providers monitor medication availability, equipment maintenance schedules, and regulatory compliance, ensuring patient safety and adherence to industry standards.
- Cost Optimization: Healthcare organizations must manage costs effectively while maintaining high standards of patient care. Power BI dashboards allow stakeholders to analyze supply chain costs, identify cost-saving opportunities, and optimize procurement processes, ultimately reducing operational expenses and improving financial performance.
In the manufacturing industry, supply chain data visualization is essential for streamlining production processes, optimizing inventory management, and meeting customer demand. Power BI supply chain dashboards can provide manufacturers with insights into production schedules, inventory levels, supplier performance, and distribution logistics. Here’s how the manufacturing industry can benefit from Power BI supply chain dashboards:
- Production Planning and Scheduling: Manufacturing companies must balance production schedules with demand forecasts to ensure timely delivery of products to customers. Power BI dashboards enable manufacturers to monitor production schedules, track work-in-progress inventory, and identify production bottlenecks, facilitating efficient production planning and scheduling.
- Inventory Optimization: Maintaining optimal inventory levels is critical for minimizing carrying costs and preventing stockouts or overstocking. Power BI dashboards allow manufacturers to analyze inventory levels, demand patterns, and supplier lead times, enabling them to optimize inventory management strategies and reduce inventory holding costs.
- Supplier Performance Management: Manufacturers rely on suppliers to provide raw materials, components, and parts for production. Power BI dashboards enable manufacturers to monitor supplier performance, track delivery schedules, and identify quality issues, ensuring a reliable and efficient supply chain.
- Quality Control and Compliance: Ensuring product quality and compliance with regulatory standards is essential for manufacturing companies. Power BI dashboards can help manufacturers track quality metrics, monitor production processes, and identify areas for improvement, enhancing product quality and regulatory compliance.
- Customer Satisfaction: Meeting customer demand and delivering products on time are key priorities for manufacturing companies. Power BI dashboards enable manufacturers to track order status, monitor delivery performance, and analyze customer feedback, ensuring high levels of customer satisfaction and loyalty.
Challenges that SMBs Decision Makers Face in Supply Chain Management
Small and medium-sized businesses (SMBs) face unique challenges in supply chain management that can impact their operational efficiency, profitability, and consumer satisfaction. Power BI supply chain dashboards offer valuable solutions to address these challenges and empower SMB decision-makers to make informed decisions. Here are some common challenges faced by SMBs in supply chain management and how Power BI dashboards can help solve them:
1. Limited Visibility and Transparency:
SMBs often lack visibility into their supply chain processes, making it difficult to track inventory levels, monitor supplier performance, and identify potential bottlenecks or issues. Power BI dashboards provide real-time visibility into key supply chain metrics and performance indicators. Decision-makers can access interactive visualizations that offer insights into inventory levels, order statuses, and supplier performance, enabling them to make data-driven decisions and optimize supply chain operations.
2. Inefficient Inventory Management:
Businesses struggle with managing inventory levels effectively, leading to stockouts, overstocking, and excess carrying costs. Power BI dashboards enable SMBs to monitor inventory levels, track demand patterns, and analyze inventory turnover rates. Decision-makers can use visualizations to identify slow-moving inventory, forecast demand more accurately, and optimize inventory levels to minimize carrying costs while ensuring product availability.
3. Poor Supplier Performance:
There are many challenges related to supplier reliability, quality issues, and delivery delays, impacting production schedules and customer satisfaction. Power BI dashboards allow SMBs to track supplier performance metrics such as on-time delivery rates, quality control metrics, and lead times. Decision-makers can use visualizations to identify underperforming suppliers, address quality issues, and establish strategic partnerships with reliable suppliers to ensure a seamless supply chain flow.
4. Lack of Data-driven Decision-making:
Decision-makers within organizations may rely on intuition or outdated information when making supply chain decisions, which can lead to poor outcomes. Power BI dashboards offer access to real-time, accurate data and actionable insights. By analyzing key supply chain metrics such as order fulfillment rates, transportation costs, and inventory turnover, decision-makers can make informed choices to optimize supply chain cycles, reduce costs, and improve overall efficiency.
5. Difficulty in Identifying Trends and Patterns:
Decision-makers within organizations may rely on intuition or outdated information when making supply chain decisions, which can lead to suboptimal outcomes. Power BI dashboards offer access to real-time, accurate data and actionable insights. By analyzing key supply chain metrics such as order fulfillment rates, transportation costs, and inventory turnover, decision-makers can make informed choices to optimize supply chain cycles, reduce costs, and improve overall efficiency.
6. Limited Resources for IT Infrastructure and Analytics:
Limited resources often pose a challenge for SMBs looking to invest in sophisticated IT infrastructure and analytics solutions. However, Power BI offers a user-friendly and cost-effective alternative. With its intuitive interface and cloud-based deployment options, SMBs can quickly deploy Power BI dashboards without extensive resources. This allows them to leverage data analytics for supply chain improvements effectively.
Logistics Performance Management
Logistics Performance Management involves monitoring and optimizing various aspects of the supply chain to ensure efficient and cost-effective operations. SMBs can utilize the Logistics Performance Management dashboard to track key performance indicators (KPIs) and metrics across different logistics functions. This dashboard provides insights into critical areas such as:
- On-time delivery performance
- Order fulfillment cycle time
- Inventory accuracy and turnover
- Transportation cost per unit
- Warehouse capacity utilization
- Carrier performance metrics
- Inbound and outbound shipment volumes
- Supply chain visibility
- Warehouse and distribution center productivity
- Customer service metrics
Benefits of Supply Chain Data Visualization
1. Proactive Risk Management
2. Trend Identification
3. Security Assurance for Confidential Data
4. Improved Inventory Management
5. Cost Optimization
6. Enhanced Data Visibility
Conclusion
In conclusion, supply chain data visualization, facilitated by tools like Power BI, is revolutionizing the way businesses manage their operations. By providing real-time insights, actionable analytics, and intuitive visualizations, Power BI dashboards empower decision-makers to optimize supply chain processes, enhance customer satisfaction, and drive business success.
From improving logistics management and supplier performance to reducing costs and mitigating risks, the benefits of supply chain visualization are numerous and impactful. As businesses navigate the complexities of today’s global marketplace, utilizing the power of data visualization is essential for staying competitive, agile, and resilient in the face of evolving challenges and opportunities.
Sunflower Lab provides excellent Power BI Dashboard Development Services, for organizations of all sizes. Contact Us today and our team will be happy to assist you further on your Power BI journey.
Drive Success with Our Tech Expertise
Unlock the potential of your business with our range of tech solutions. From RPA to data analytics and AI/ML services, we offer tailored expertise to drive success. Explore innovation, optimize efficiency, and shape the future of your business. Connect with us today and take the first step towards transformative growth.
You might also like
Stay ahead in tech with Sunflower Lab’s curated blogs, sorted by technology type. From AI to Digital Products, explore cutting-edge developments in our insightful, categorized collection. Dive in and stay informed about the ever-evolving digital landscape with Sunflower Lab.