Power BI Consulting Services in Houston
We help Houston companies design, build, and manage Power BI dashboards on Microsoft Fabric and SharePoint. Our team covers the full stack — source data, semantic model, and reporting — so you have one point of accountability for the numbers on your dashboard.
Where Houston teams typically get stuck with Power BI
Most Houston companies we work with already have a Power BI license, but not a governed source of data feeding it. The four issues below are the ones we see most often during initial assessments.
Data spread across systems
SharePoint, SQL, Dynamics 365, Excel, and email each hold a different version of the same figure.
No owner for the data model
DAX measures are patched ad hoc, and two dashboards can report two different revenue totals.
Unclear Fabric capacity sizing
Teams either overpay for F-SKUs they do not need or reach a capacity limit mid-quarter.
Limited internal knowledge
Handover was documentation, not a working session, and internal staff cannot maintain the reports.
What our Power BI engagement covers
Our engagements cover three connected areas: source data in SharePoint, the unified data layer in Microsoft Fabric, and Power BI reporting. All three are delivered by the same team under one statement of work.
SharePoint governance and cleanup
A governed foundation for your reports.
- Audit of every SharePoint site, list, and file that feeds your reports
- Structured Lists in place of shared Excel files
- Permissions and retention policies aligned with reporting needs
- Power Automate approval flows feeding the model directly
Microsoft Fabric setup and modeling
One consolidated layer across your systems.
- OneLake medallion architecture (bronze, silver, gold)
- Data pipelines from SharePoint, Dynamics 365, SQL, Salesforce, SAP, and IFS Oracle
- Fabric capacity sizing appropriate to your workload
- A semantic model with governed DAX definitions
Power BI dashboards and enablement
Reports for executives, operations, and finance.
- Executive, operations, and finance dashboards (for AMOT: Revenue & Finance, Inventory & Backlog, Orders & Booking)
- Row-level security by role or department
- Copilot and natural-language Q&A on the semantic model
- Team training on Central time and a written runbook
Comparing your options
Most teams consider three paths: a single integrated partner, multiple specialist vendors, or an in-house build. The table below outlines the trade-offs of each so you can decide which fits your situation.
| With Sunflower Lab | 3 separate vendors | Internal DIY | |
|---|---|---|---|
| Time to first working dashboard | 4–8 weeks | 4–6 months | 6–12 months if it ships |
| Who owns the number being right? | One team, one SOW | Three vendors pointing sideways | Whoever's still there |
| Experience with Houston industrial, energy & healthcare stacks | Delivered for AMOT & Metrix Vibration | Varies vendor to vendor | Depends on your hires |
| SharePoint data cleaned before it hits BI | Included | Out of scope | "We'll get to it" |
| Fabric + AI Capability | Included | Extra engagement | Usually overpaying |
| Team training + documented handover | Included | Add-on | N/A |
| Delivery on Central time | Central-time delivery pods | Often offshore | N/A |
| Best fit | A 10–500 person M365 organization that wants AI and automation built in | A Fortune 500 with a dedicated PMO | A 20-person startup with a data engineer to spare |
Note on fit: organizations with a full internal data-platform team (typically Fortune 500 energy majors) generally do not need an external partner. Most mid-market Houston organizations do.
Typical 4 to 8 week timeline
Every engagement follows the same four phases. Actual duration depends on the number of data sources and whether a Fabric migration is in scope.
Discovery
A 30-minute call followed by a 3-day audit of your SharePoint sites, existing PBIX files, and Fabric capacity. A written scope is provided at the end of week one.
Ingest and model
SharePoint sources are cleaned, OneLake medallion architecture is set up, and the first 8–15 governed metrics are defined and reviewed with your team.
Build dashboards
Executive, operations, and finance dashboards are built against the model. For AMOT, this phase delivered Revenue & Finance, Inventory & Backlog, and Orders & Booking dashboards.
Training and handover
Live training for your team, a written runbook, and 30 days of post-launch support. A monthly retainer is available for ongoing maintenance.
Selected Houston engagements
Three recent engagements across manufacturing, industrial instrumentation, and healthcare technology. Each began with fragmented reporting data and ended with a single governed layer feeding live dashboards.
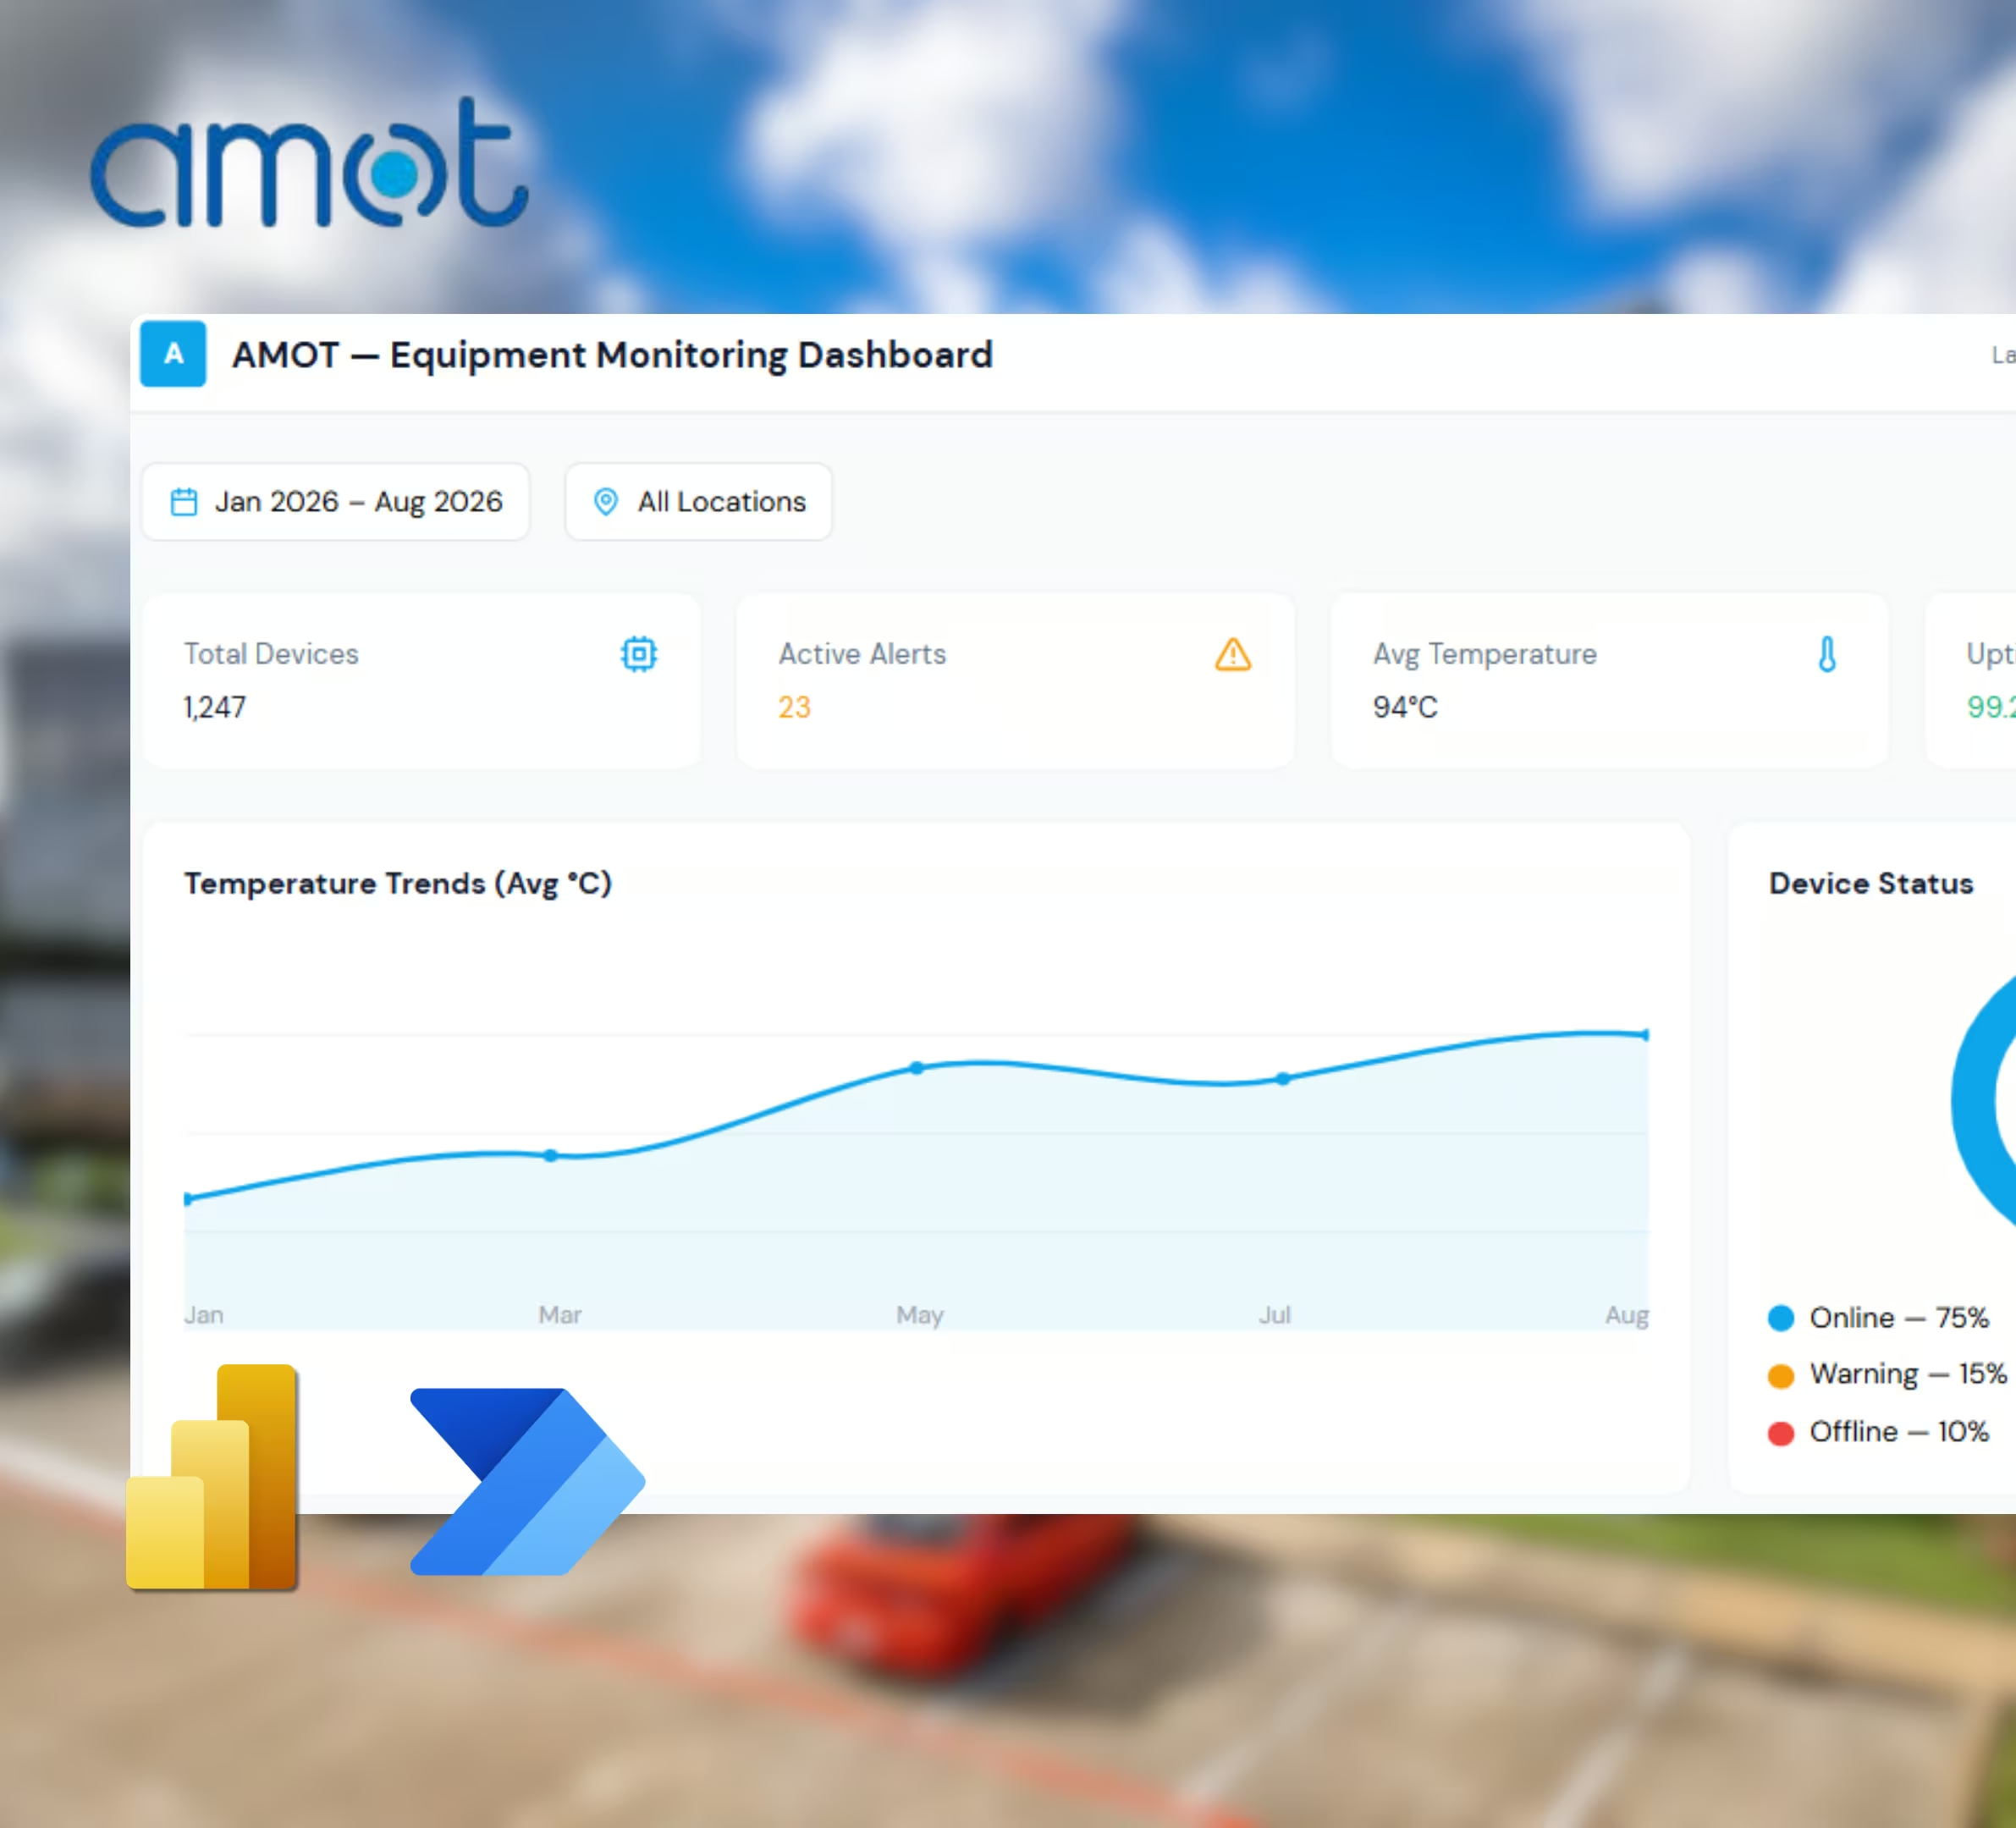
AMOT Controls — Power BI dashboard suite
AMOT had large volumes of data spread across sources covering international bookings, revenue, inventory, backlog, and pipeline, with no consolidated way to visualize it. Scope of work: a Power BI dashboard suite powered by DAX — Revenue & Finance, Inventory & Backlog, and Orders & Booking — with real-time forecasting on Power BI, SQL Server, SSIS, and Dynamics 365.
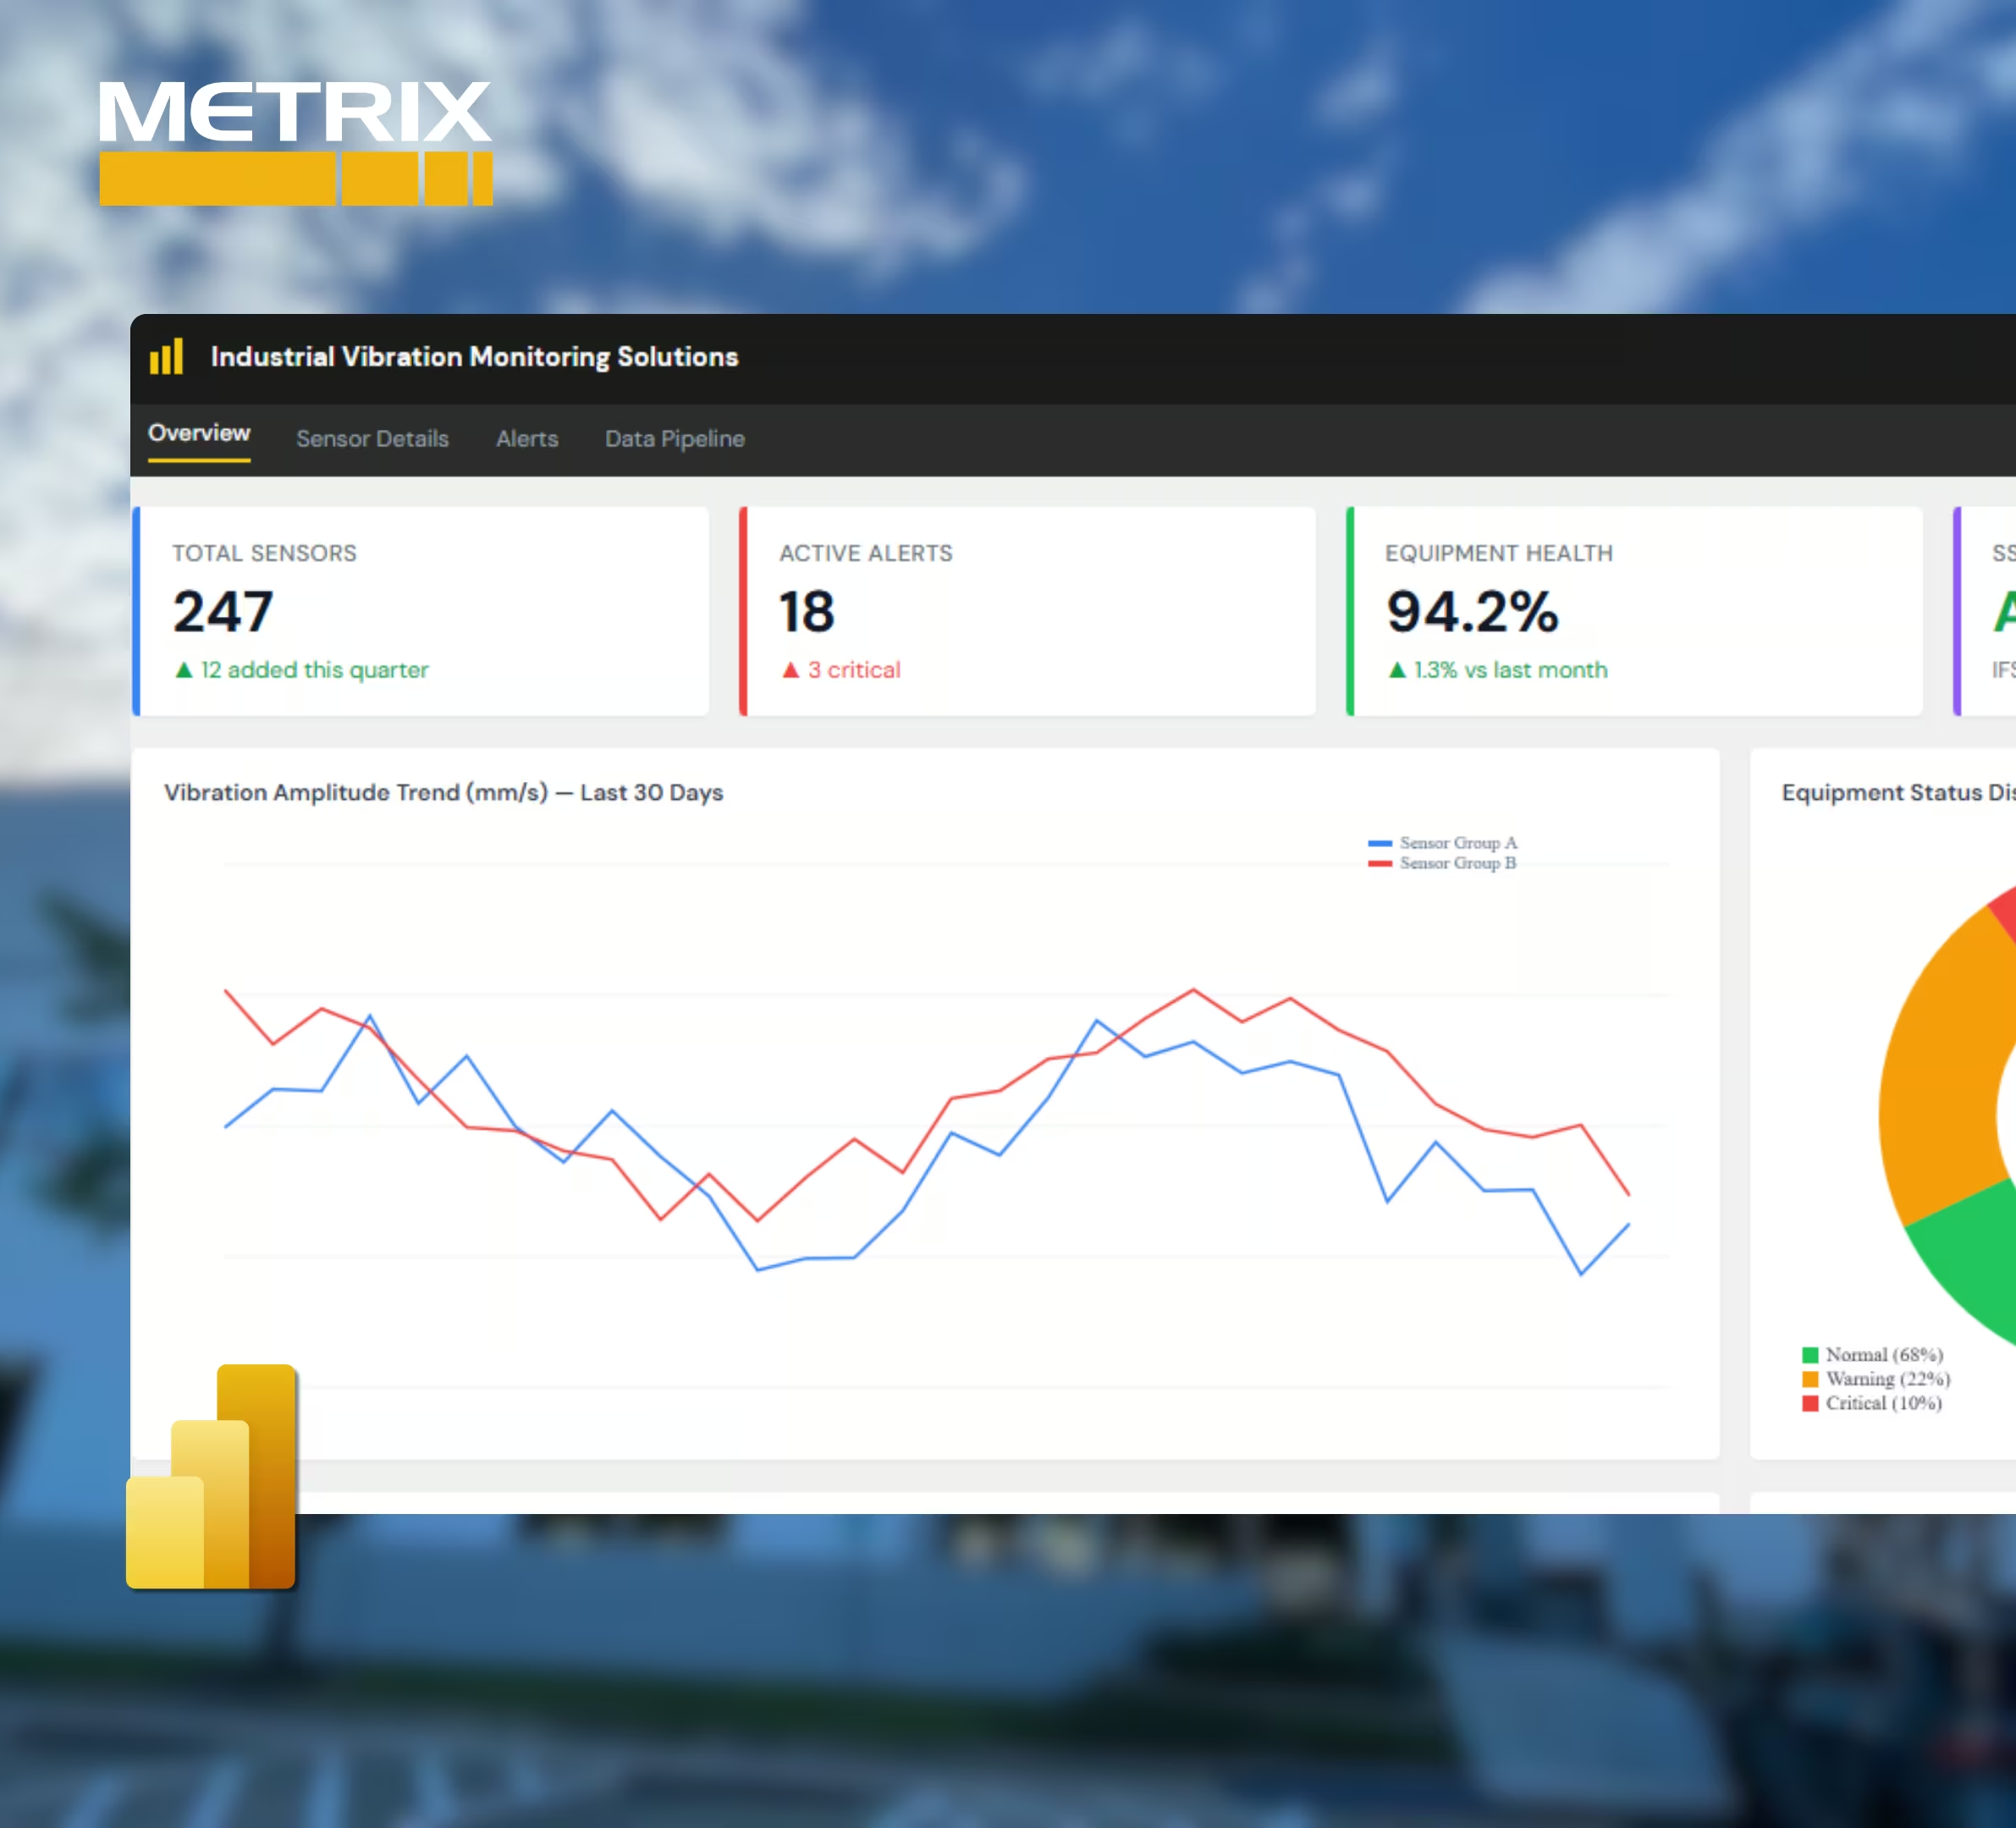
Metrix Vibration — Global ERP reporting pipeline
Metrix's operational data sat inside its IFS Oracle ERP: fragmented, siloed, and disconnected from the rest of the business. Every report required manually rebuilding spreadsheets. Scope of work: an automated SSIS pipeline extracting data from IFS Oracle ERP into SQL Server, with cleansing logic that converts raw ERP data into ready-to-use reports.

IONM Provider — Central data hub across clinical systems
Case data, physician records, and billing information were spread across Cadwell, Revedy, HubSpot, and payer platforms, with no central system connecting clinical data to business processes. Scope of work: ZinniaX as the central data hub, with automated bots pulling case files and technician records, syncing HubSpot to eliminate duplicate entry, and connecting Cadwell and Revedy outputs back for coding and case updates.

Certified Microsoft Solutions Partner
Sunflower Lab holds Microsoft Solutions Partner status for Power BI, Fabric, and SharePoint. This designation requires audited technical delivery, data governance, and client outcome standards defined by Microsoft.
Frequently asked questions
Request a consultation
Schedule a 30-minute call to discuss your current Power BI setup and reporting needs. You will receive a written scope tailored to your environment and a fixed-price estimate within three business days.