Empower Your Miami Business by Tapping into Smart Data through Power BI
We help Miami companies in international trade, financial services, and healthcare design, build, and manage Power BI dashboards on Microsoft Fabric — from our Brickell Key office, with one team covering source data, the semantic model, and reporting.
Our Esteemed Clientele









Data Analysis With Real-Time Business Intelligence
Our experts at Sunflower Lab create interactive dashboards and reports that transform raw, complex operational metrics into intelligent, actionable insights through the power of Power BI — for Miami businesses running data across a TMS, an EHR, a property-management system, or multiple LatAm entities.
- Track inventory, backlogs, revenues, pipelines, and orders on a single dashboard.
- Real-time dynamic updates ensure you act on today's figures, not yesterday's.
- Integration of advanced forecasting tools to project and plan future operations.

Power BI Meets Microsoft Fabric
Microsoft Fabric is Microsoft's unified data platform, seamlessly combining data lake capabilities (OneLake), data engineering pipelines, data warehousing, and Power BI into one SaaS environment. For businesses already using Power BI, Fabric eliminates fragmented data repositories, simplifying storage, sharing, and governance.
Fabric ConsultationPower BI Dashboards + SharePoint
A Power BI dashboard is only as reliable as what's behind it. Most teams patch it together from exports, manual refreshes, and a spreadsheet someone updates "when they get a chance" so two people pull up the same report and get two different numbers. Sunflower Lab builds Power BI dashboards that connect directly to your existing SharePoint lists and libraries, so the data stays live, permissioned, and traceable back to a single source. No exports. No shadow copies. No meeting to figure out whose number is right.
SharePoint Consultation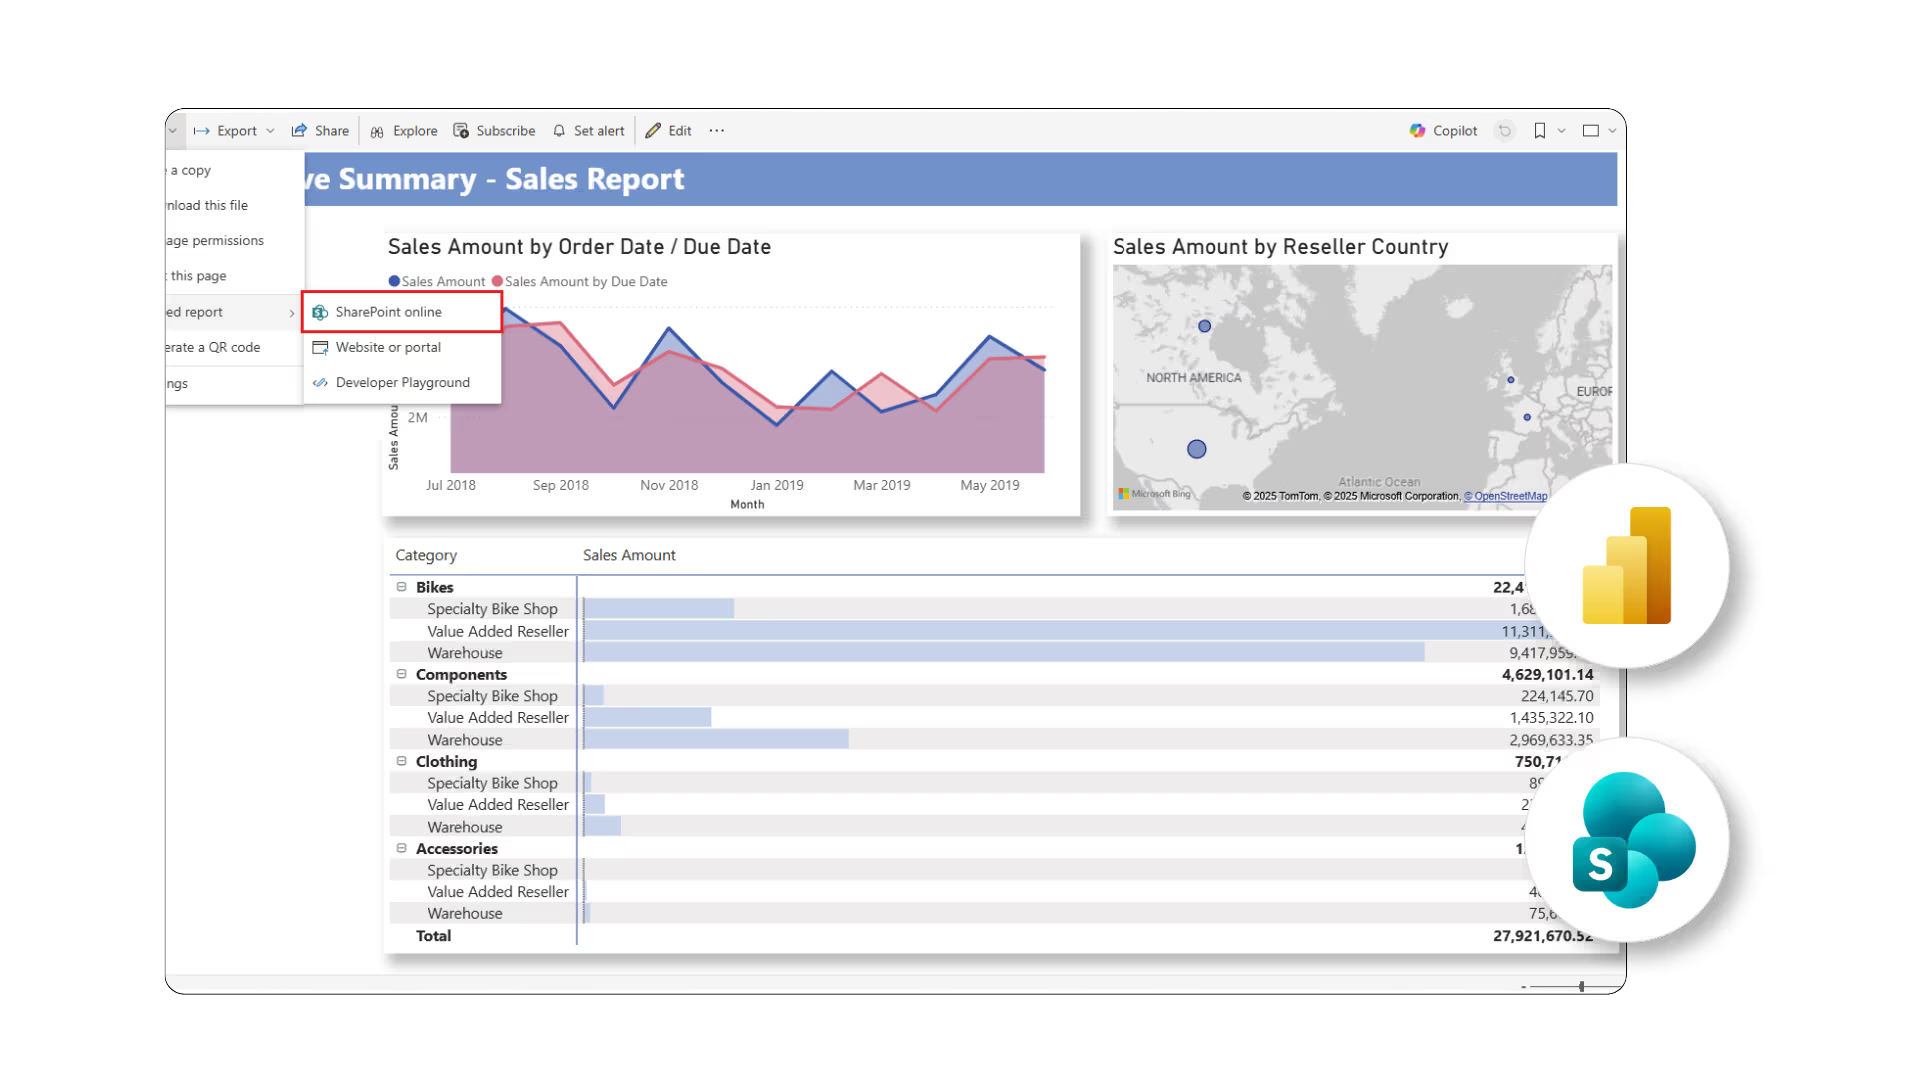
Power BI App Development Services
Empower your business with smart data modeling, analytics integration, custom reporting tools, and seamless data visualization.
Power BI Dashboard Development
We create beautiful, unified control panels showing dynamic and real-time operational indicators rather than delayed static figures.
DAX in Power BI
Our team enhances standard dashboards using advanced DAX modeling queries to enable time-intelligence and complex analytical math formulas.
Power BI Integration
Integrate interactive reports into SharePoint, Dynamics 365, Teams, and custom client-facing applications via secure APIs.
Power BI Reporting
Design optimized, paginated documents and mobile reports so teams can share, filter, and review insights securely while on the go.
Data Modeling
Establish high-quality, normalized schemas, relations, and stars to maintain computational performance even when handling billions of records.
Power BI Migration
Ensure seamless consolidation onto Power BI and Fabric from older reporting systems like Tableau, Cognos, or scattered Excel sheets.
Why Businesses Choose Power BI
A deep dive into the technical features that drive analytical capabilities.
Interactive Visualizations
Raw numbers are difficult to digest. Visualization transforms tabular records into responsive maps, column charts, scatter plots, tree maps, and pie charts. Customize visual templates to match company branding while giving end users absolute filtering options.
Request DemoCloud-Based Access & Pipelines
Access analytics from anywhere. The cloud-based Power BI Service supports automated gateway synchronization, scheduled data flow refreshes, row-level security, and seamless embedding within external portal structures.
Explore Cloud SolutionsWorkspace & Team Collaboration
Eliminate duplicate Excel copies and version confusion. Build reports in dedicated team workspaces, configure granular view/edit permissions, write comments, tag peers, and share live interactive charts directly inside Microsoft Teams channels.
Request Collaboration DemoAdvanced Data Modeling
Perform lightning-fast analysis on millions of records. Power BI employs advanced data compression, normalization techniques, time-intelligence variables, and DAX query optimization, maintaining swift loading speeds across large datasets.
Consult Data ArchitectSecure Mobile Access
Check key metrics on the road. The responsive Power BI Mobile application offers offline views, alerts on threshold deviations, and secure active directory authorization checks matching web-portal security levels.
See Mobile ViewPower BI Only vs Power BI + Fabric
How standard reporting compares to a unified, end-to-end data platform.
Transformations We've Delivered
See how we have helped healthcare and manufacturing clients turn scattered exports into dashboards their teams actually use — the same approach we bring to Miami's trade, finance, and healthcare businesses.
SaaS Healthcare Platform KPI Analysis Dashboards
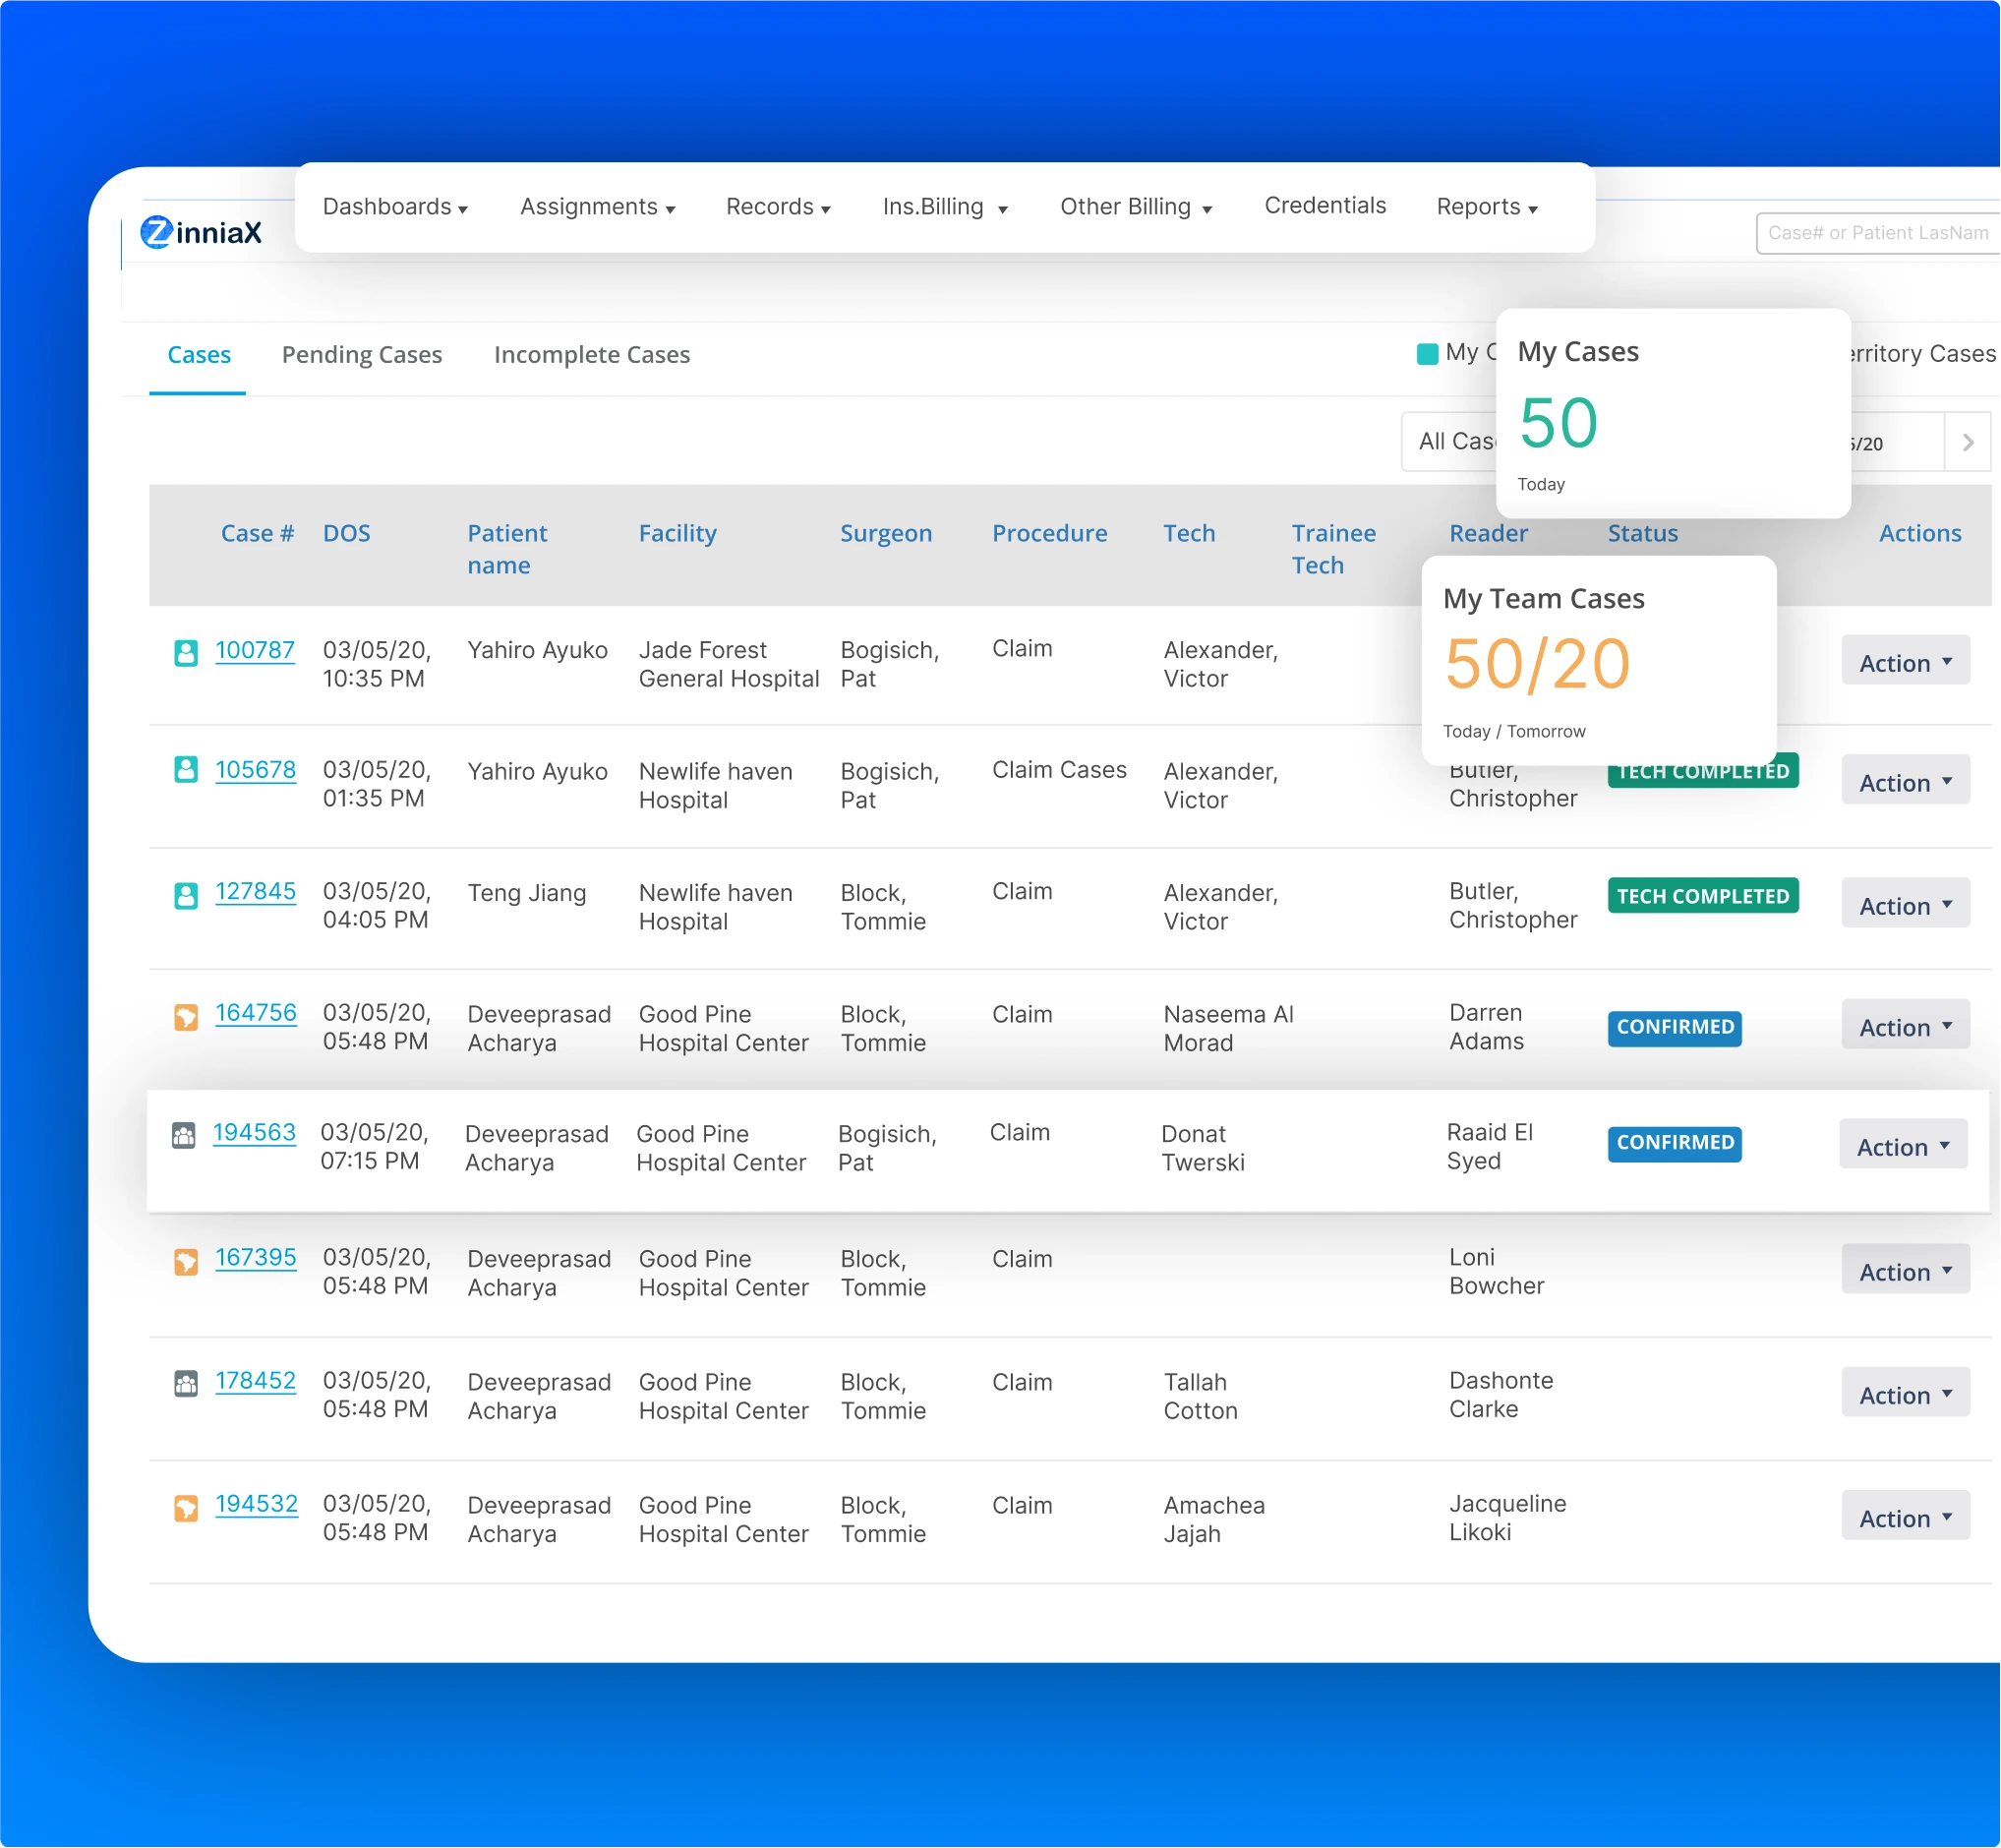
We integrated dynamic Power BI visual structures within Zinniax's SaaS medical tool. The dashboard streams and analyzes claim management, EMR databases, and patient histories, streamlining key medical diagnostics — the kind of claims and EHR consolidation South Florida's large health-plan and managed-care market runs on daily.
Upgrade Data Pipelines & Operations
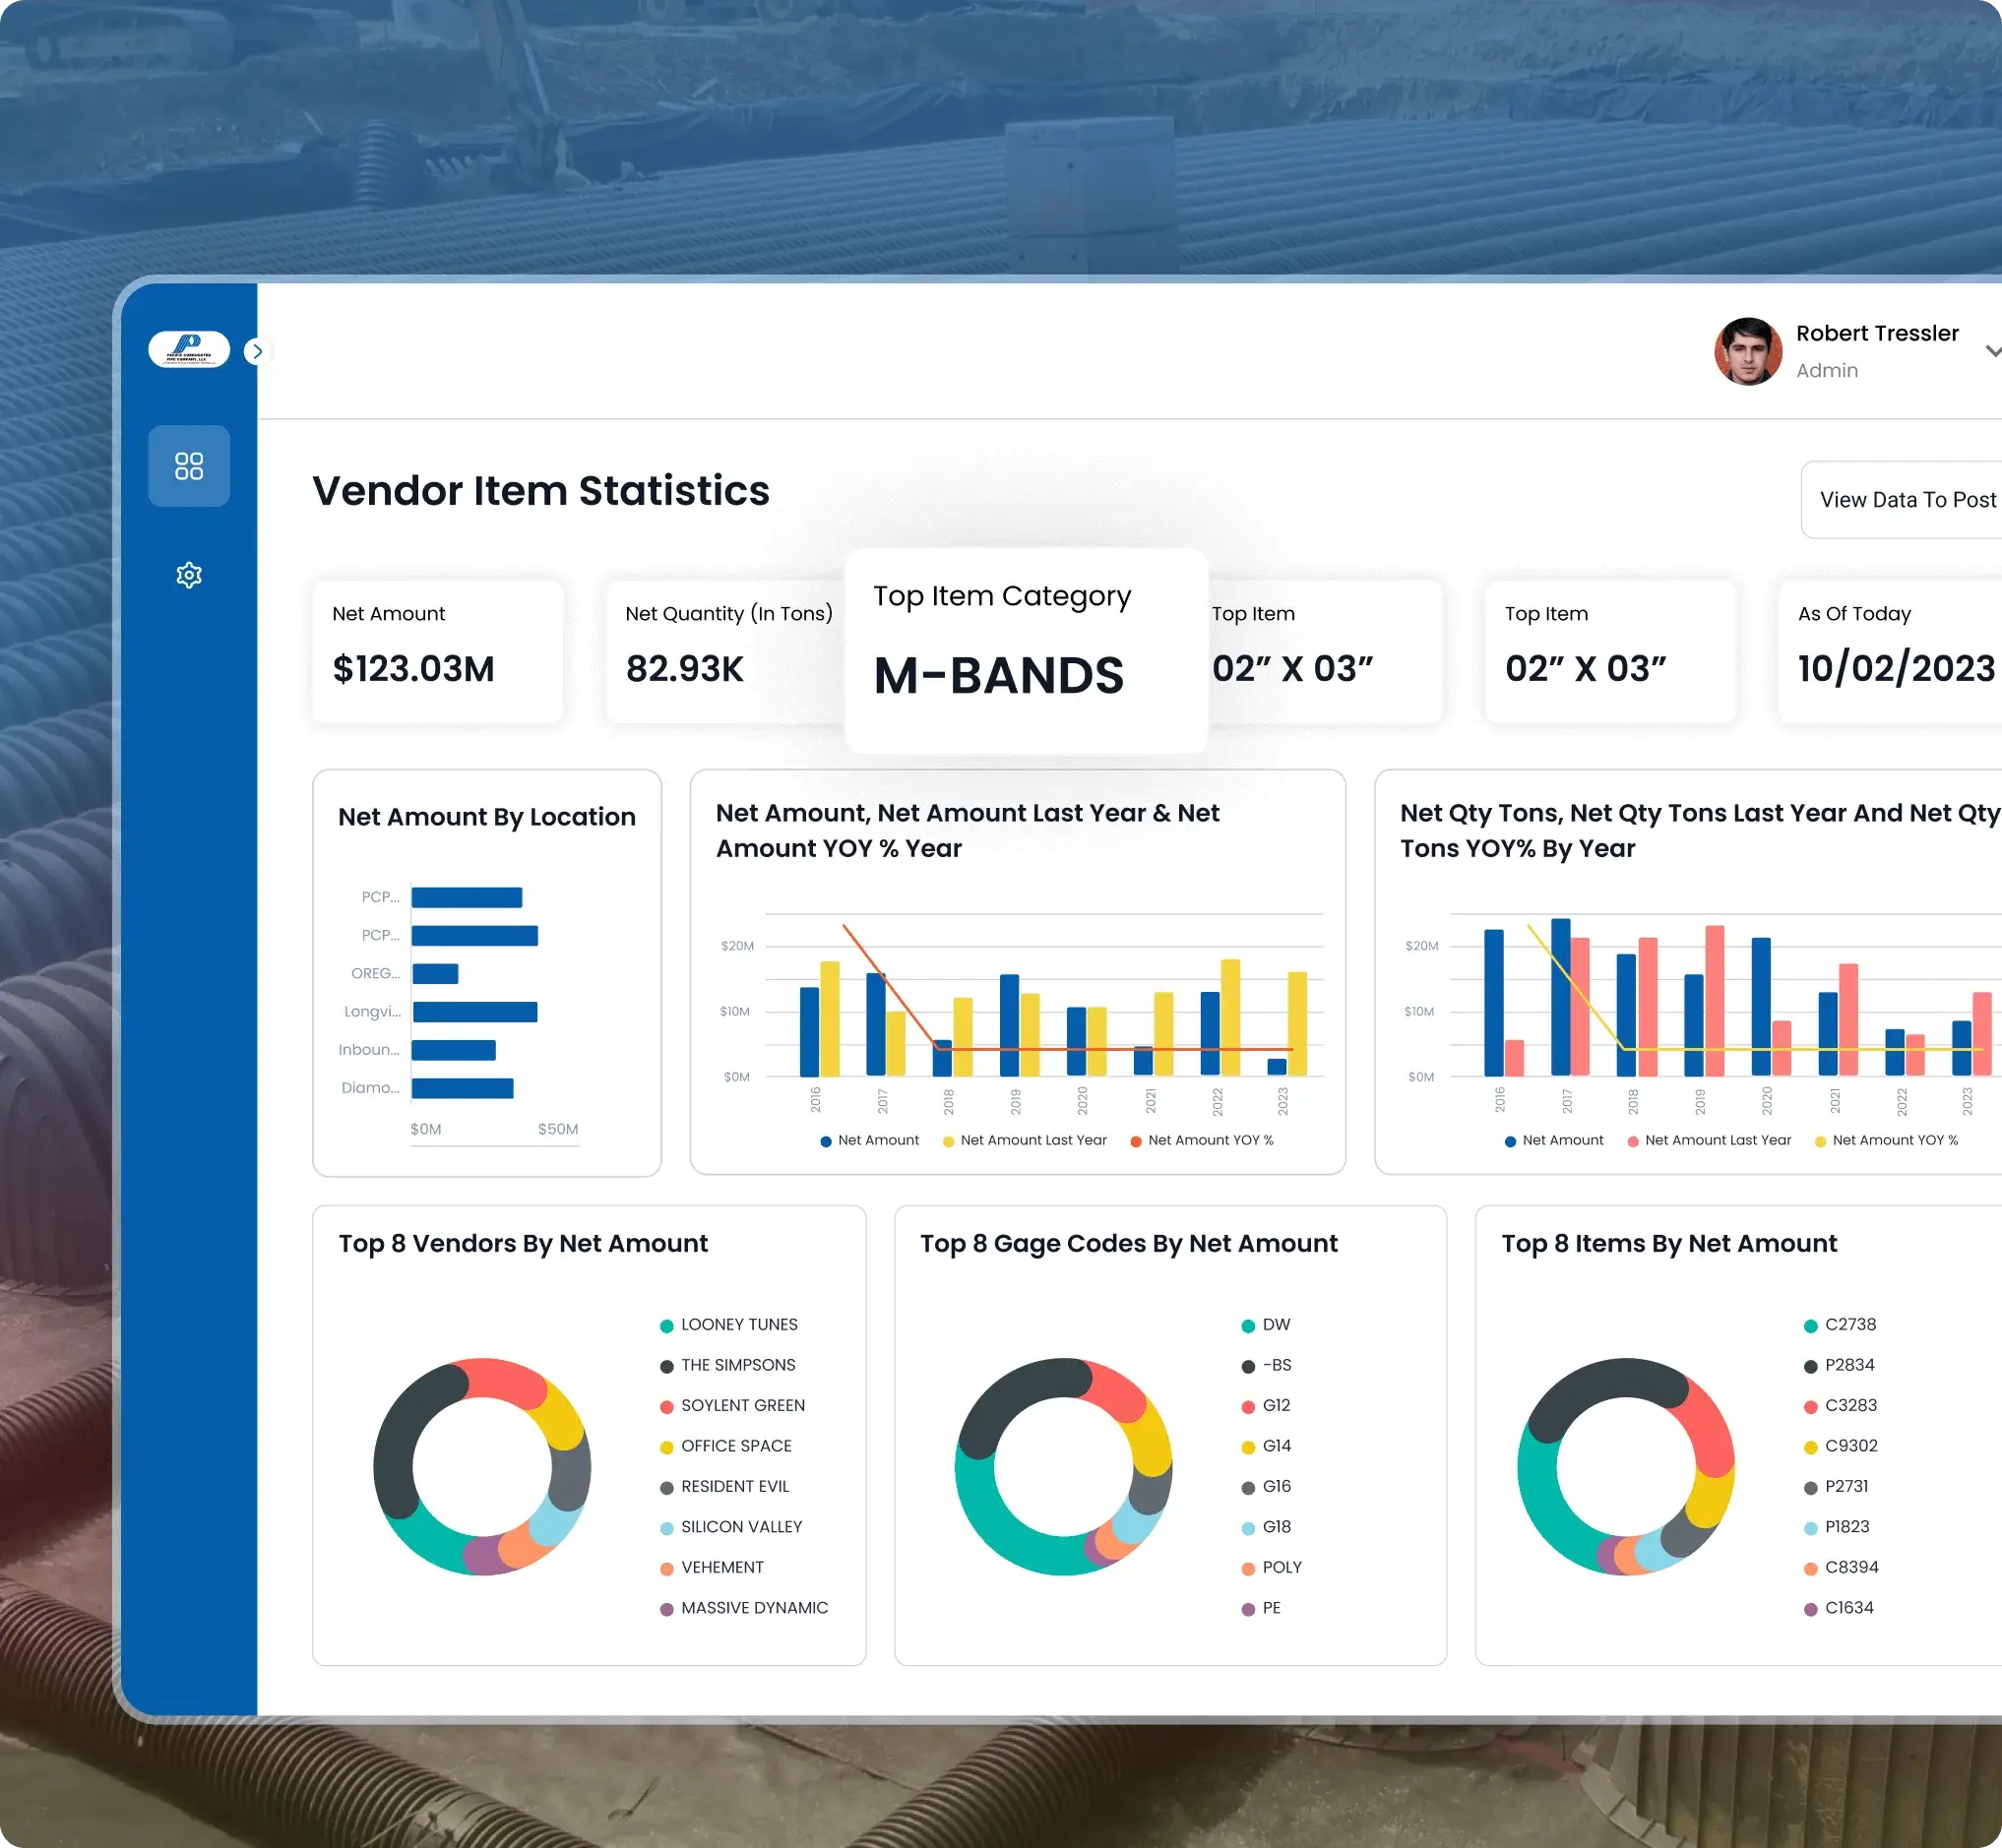
Sunflower Lab architected a secure cloud Synapse database pipeline for Pacific Corrugated Pipe, a multi-plant manufacturer. The pipeline moves on-premise ERP datasets into a secure data lake on an automated schedule, feeding clean, plant-by-plant dashboards — the same multi-location reporting problem South Florida's manufacturers and distributors run into.

"Zinniax has dramatically improved the efficiency of our operations. Repetitive and time-consuming tasks that used to take up a significant portion of the team's workday are now handled seamlessly by the RPA system. This allows to redirect of resources and manpower toward more strategic and high-value tasks. Your team's support throughout the development and implementation process has been exceptional."
Frequently Asked Questions
Have questions about Power BI dashboard development or Microsoft Fabric integration for your Miami business? We have answers.
Talk to our Power BI experts
Free 30-minute discovery call. We'll audit your workflows, estimate timelines, and help you map out your automation goals.